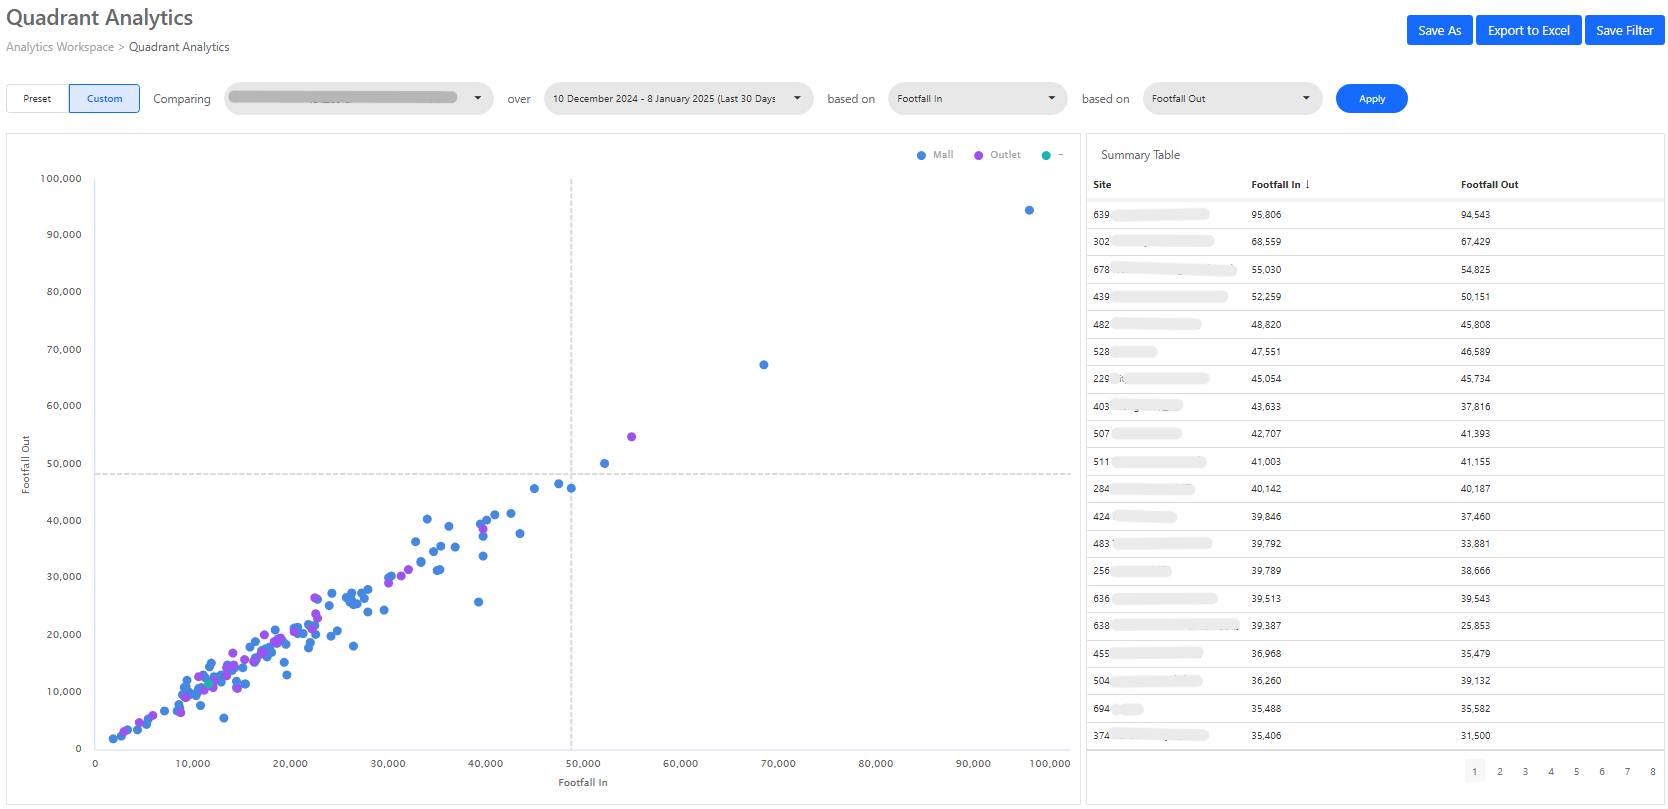
The Quadrant Analysis dashboard is a powerful tool for retailers, providing a clear visual representation of store performance by comparing key metrics. It helps you answer critical business questions and optimise both sales and operations.

Use Case for Retail:
- Identify Top-Performing Stores: Understand which stores are excelling in footfall conversion rates and sales.
- Pinpoint Underperforming Locations: Spot stores that have high traffic but low conversion, helping you focus on improving marketing, layout, or staff training.
- Optimise Resource Allocation: Use the data to justify where to allocate more staff, adjust store hours, or target marketing efforts.
Questions the Quadrant Analysis Answers:
Which stores are driving the most revenue and why?
Where is footfall high but sales underperforming?
Which locations need operational improvements, such as better staffing or layout adjustments?
How does footfall data correlate with store sales?
Sales and Operations Justification:
Sales Justification: By identifying stores with high traffic but low conversion, you can adjust marketing strategies to boost sales, focus on upselling, or refine in-store promotions.
Operations Justification: Highlight stores that need operational improvements, such as more staffing during peak hours or better training for staff to close sales effectively. This data-driven approach helps justify changes to store operations for better results.
#footfallcam #v9 #peoplecounting #peoplecounter #retail #ffcpartneroftheweek


