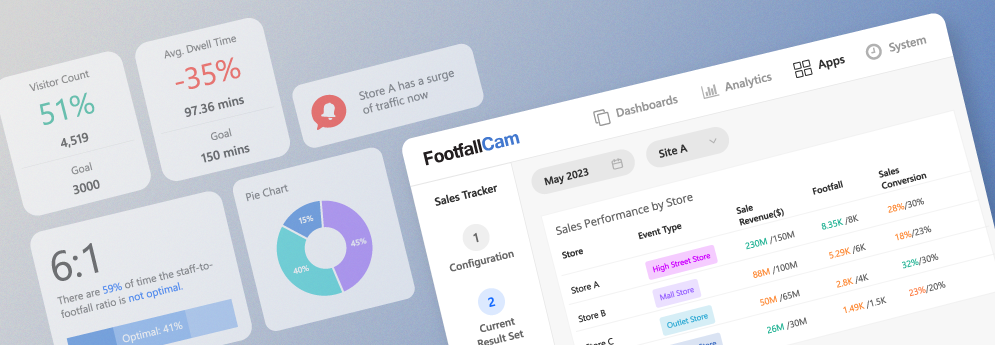
Dive into the realm of key performance indicators (KPIs) and metrics to design an effective and actionable dashboard. Identify vital metrics, set realistic goals, and choose compelling visualizations to tailor a dynamic dashboard for informed decision making.

Designing an actionable operational dashboard for a retail business involves creating a visual representation of key performance indicators (KPIs) and metrics that provide real-time insights into various aspects of the business. Here are some steps to help you design an effective operational dashboard:
- Identify Key Metrics: Determine the most important metrics that align with your retail business objectives. These may include sales revenue, sales by product category, conversion rates, average transaction value, foot traffic, inventory levels, employee productivity, customer satisfaction scores, and others.
- Set Goals and Targets: Establish specific targets or goals for each metric. These goals should be realistic, measurable, and aligned with your business objectives. Having clear targets helps track progress and identify areas that require attention.
- Choose Visualisations: Select appropriate visualisations that effectively communicate the data and allow for easy interpretation. Use charts, graphs, tables, and other visual elements to represent the metrics. Common visualisations for retail dashboards include line charts, bar charts, pie charts, and heat maps.
- Organise Dashboard Layout: Organise the dashboard layout in a logical manner to provide a clear and intuitive flow of information. Group related metrics together and consider the natural hierarchy or sequence in which the data should be presented. Use headings, sections, or tabs to separate different areas of focus.
- Provide Contextual Information: Include additional contextual information alongside the metrics to provide a comprehensive understanding of the data. This may involve trend analysis, historical comparisons, benchmarks, or explanatory text to provide insights into why certain trends or patterns are occurring.
- Real-Time Data Updates: Ensure that the dashboard updates in real-time or at regular intervals to provide the most current information. This allows for quick monitoring of performance and timely decision-making.
- Use Color and Alerts: Utilise colour to draw attention to important information or to highlight trends or anomalies. Implement alerts or notifications when certain metrics reach predefined thresholds, enabling immediate action when performance deviates from the desired targets.
- Customisation and Interactivity: Provide options for users to customise the dashboard based on their specific needs or roles within the organisation. This may involve allowing users to filter data, drill down into specific metrics, or select different time frames for analysis.
- Mobile Responsiveness: Design the dashboard to be mobile-responsive, allowing users to access the dashboard from different devices such as smartphones or tablets. This ensures that key information is accessible on-the-go.
- Regular Review and Iteration: Continuously review the effectiveness of the dashboard and seek feedback from users. Make iterative improvements based on user input and evolving business requirements to ensure the dashboard remains actionable and aligned with the changing needs of the retail business.
Remember, the dashboard should be tailored to your specific retail business and the metrics that matter most to your organisation. Regularly assess the relevance of the chosen metrics and adjust the dashboard as needed to ensure it provides meaningful insights and drives actionable decisions.


