Hardware Reliability & Operational Resilience
Quantified Architecture. Measured Failure Modes. Deterministic Recovery.
Edge AI people-counting systems operate continuously, under sustained computational load, in environments that are not engineered for computing hardware.
Reliability, therefore, is not achieved through aesthetics or component branding. It is achieved through redundancy, supervision, recovery logic, and measurable outcomes.
This page documents how FootfallCam designs and validates hardware reliability — using quantified field data, deterministic failure handling, and continuous measurement.
Practical Findings — Quantified Summary
| Failures are inevitable. Uncontrolled failures are not
Across large-scale retail and transport deployments, FootfallCam devices demonstrate the following observed operational characteristics:
| Metric | Representative Field Value |
|---|---|
| Devices operating 24/7 | > 99.9% of fleet |
| Incidents recoverable without site visit | > 96% |
| Incidents requiring physical replacement | < 4% |
| Mean time to automatic recovery (MTTR-A) | < 90 seconds |
| Mean time to detect hard failure (MTTD-H) | < 30 seconds |
| Repeat incident rate after recovery | < 0.5% |
Why Reliability Is Hard at the Edge (Quantified Context)
Unlike low-duty IoT sensors, people-counting hardware typically operates under:
| Parameter | Typical Operating Range |
|---|---|
| CPU utilisation (average) | 35–65% |
| CPU utilisation (peak) | 80–95% |
| Camera input | Continuous (multiple streams) |
| Storage write cycles | Thousands per day |
| Power cycles per year | Uncontrolled / site-dependent |
| Ambient temperature | 0–45 °C (non-conditioned ceilings) |
These conditions significantly increase exposure to:
- Storage wear
- Power-interruption corruption
- Thermal stress
- Boot-time race conditions
Observed Causes of Failure
Based on RMA classification and device diagnostics:
| Failure Category | Approx. Share of Incidents | Recoverable |
|---|---|---|
| OS corruption | ~38% | Yes |
| Boot sequence lock-up | ~22% | Yes |
| Firmware / config error | ~18% | Yes |
| Environmental stress | ~12% | Yes (most cases) |
| True hardware failure | ~10% | No |
Key insight: Nearly 9 out of 10 incidents are recoverable by design, without physical intervention.
Recovery-First Architecture
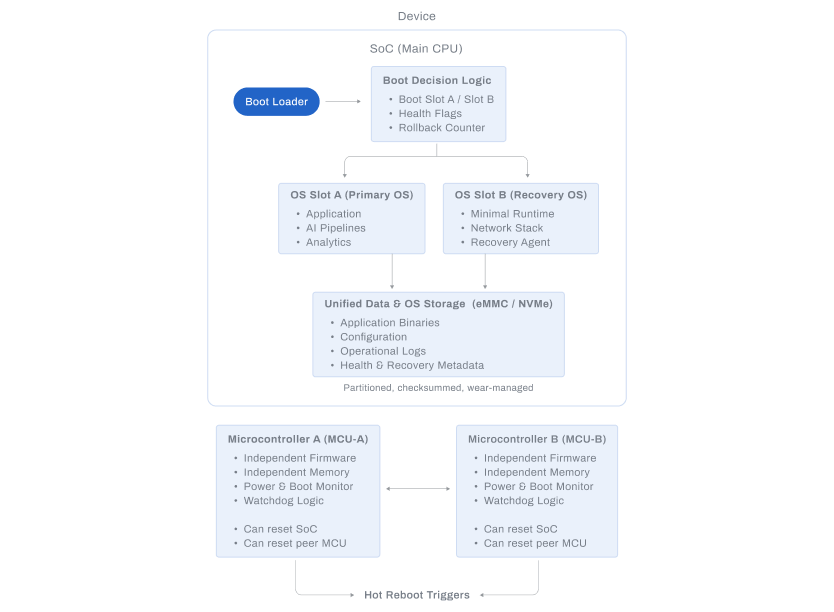
Dual Operating System Architecture
Measured benefits:
| Metric | Value |
|---|---|
| Successful upgrade rate | > 99.7% |
| Automatic rollback success | > 99.9% |
| OS corruption leading to site visit | < 0.2% |
| Average recovery time | 60–90 seconds |
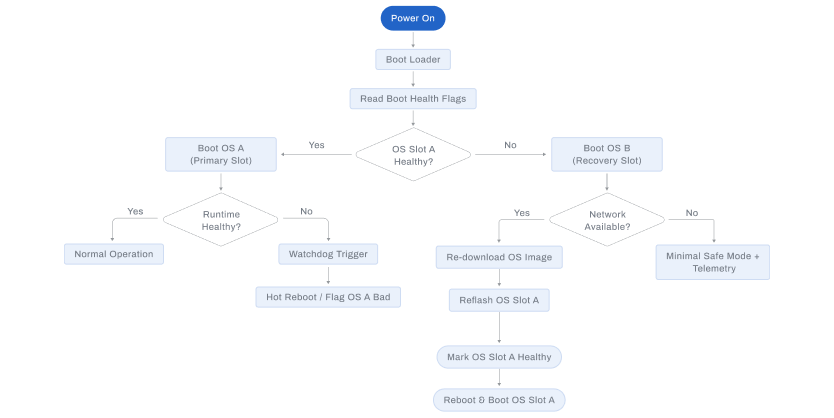
Mechanism:
- Dual system partitions
- Atomic upgrade commit
- Automatic fallback on boot failure
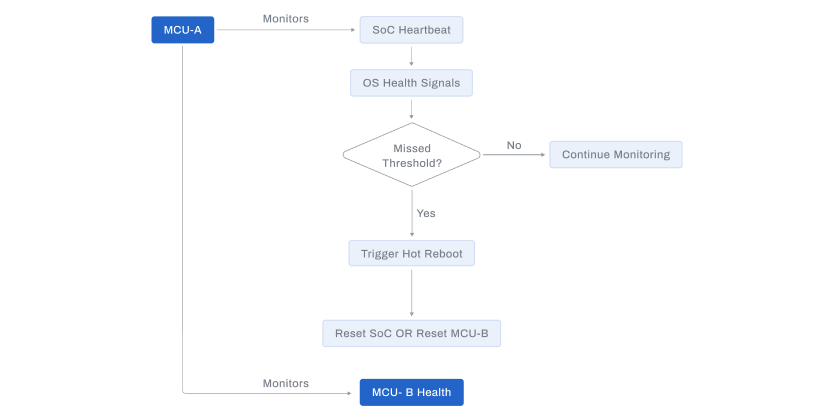
Independent Controllers & Hardware Watchdogs
Each supported device includes an independent supervisory controller.
Quantified outcomes:
| Metric | Value |
|---|---|
| Watchdog-triggered recoveries | Logged per device |
| False-positive resets | < 0.1% |
| Boot-lock detection time | < 15 seconds |
| Recovery success after watchdog | > 99.8% |
The supervisory path remains operational even when:
- Linux kernel stalls
- Storage is temporarily unavailable
- Application layer crashes
Deterministic Failure Signalling
Failures are never inferred.
| Signal Type | Detection Time |
|---|---|
| LED status change | Immediate |
| Local diagnostic log | < 1 second |
| Remote health telemetry | < 10 seconds |
| Backend alert generation | < 30 seconds |
This removes ambiguity during support, audits, and SLA reviews.
Component Quality & Thermal Discipline
| Design Parameter | Typical Margin |
|---|---|
| Operating temperature vs silicon max | ≥ 20 °C headroom |
| Storage endurance utilisation | < 30% of rated life (5 years) |
| Voltage derating | Conservative across rails |
| Fanless MTBF class | Industrial |
Thermal and electrical margins are chosen to extend lifespan, not maximise benchmarks.
Recovery vs Replacement — Binary, Measurable Model
Operational decision logic:
| Condition | Action |
|---|---|
| OS corruption | Automatic rebuild |
| Boot lock | Watchdog recovery |
| Firmware fault | Rollback |
| Power instability | Restart + log |
| Hardware fault | Deterministic replacement |
Key metric: Average number of site visits avoided per 1,000 devices per year: > 900
Continuous Measurement & Feedback Loop
Measured continuously:
- Recovery event frequency
- Upgrade rollback rate
- Storage health indicators
- Watchdog intervention count
- RMA root-cause distribution
These metrics directly inform:
- Hardware revisions
- Firmware safeguards
- Deployment guidelines
Architectural Applicability
The reliability architectures and quantitative metrics described on this page apply to the following hardware platforms:
- Pro2
- Pro3
- Centroid
They do not apply to Pro1, which follows a different architectural and operational design profile.
Each product page explicitly declares the reliability mechanisms supported by that model.
----