


Why?
- Identifying Customer Gaps - Compare actual store visitors with the estimated potential customer base in the area to uncover missed opportunities and optimize marketing strategies.
- Targeting Right Customers Segments - Analyse demographics and shoppers' behaviours to tailor product offerings and promotions to the most relevant customer groups.
- Store Growth Planning - Assess population density and street busyness levels to determine whether a store should expand, relocate, or reduce its size for better profitability.
Target Audiences:
Property Teams, Marketing Teams & Store Managers
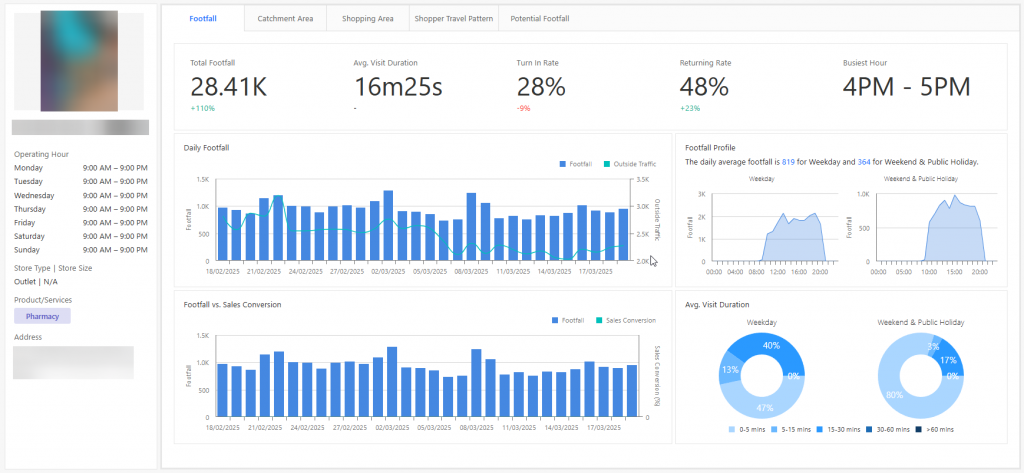
1.1 Footfall Summary
Footfall Summary page is the first screen you see upon entering the app, providing a quick overview of a store's monthly performance. At the top, key footfall metrics are highlighted. Below, four key insights are displayed: two charts comparing daily footfall vs. outside traffic and sales conversion each, helping to assess store performance. On the right, a breakdown of average footfall for weekdays and weekends & public holidays is shown, while the bottom-right section presents average visit duration for these periods in easy-to-read donut graphs.
Use Cases:
- Optimise Store Locations - Compare footfall trends with outside traffic to assess site viability and make informed leasing decisions.
- Enhance Marketing Strategies - Analyse peak hours and sales conversion rates to refine promotions and measure campaign impact.
- Improve Store Operations - Adjust staffing and inventory based on footfall patterns to enhance efficiency and customer experience.
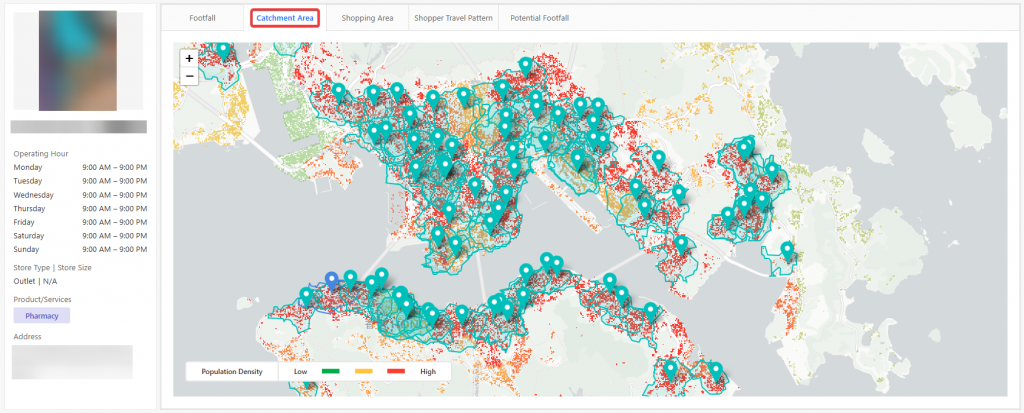
1.2 Catchment Area
Catchment Area Analysis offers businesses a comprehensive view of population density nationwide. By mapping all stores locations on the map, businesses gain a clear visual representation of their proximity to high-density areas, helping identify optimal sites for growth and ensuring cost-effective operations.
Use Cases:
- Strategic Store Placement - Identify high-population areas to minimize the risk of poor site selection.
- Expansion & Optimization - Utilize data to decide where to open, relocate, or close stores for maximum efficiency.
- Lease Negotiation - Compare store performance in similar areas to secure fair rental rates and avoid overpaying.
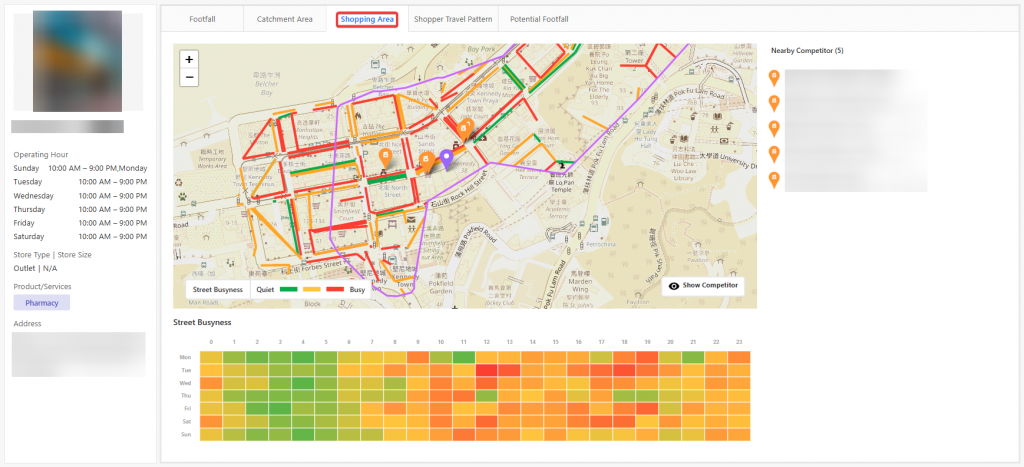
1.3 Shopping Area
Shopping Area Analysis helps businesses understand foot traffic patterns by analysing street busyness by day and hour and identifying nearby competitors. This data allows retailers to optimize store operations, adjust staffing and inventory based on peak hours, and refine marketing strategies. Additionally, insights on competitor locations and traffic trends support better lease negotiations and strategic decision-making for store expansion or relocation.
Use Cases:
- Optimise Store Performance - Leverage foot traffic data by day and hour to adjust staffing, operating hours, and inventory, enhancing efficiency and customer experience.
- Competitor Analysis - Assess nearby competitors, their locations, and traffic patterns to refine pricing, promotions, and marketing strategies for a competitive edge.
- Lease Negotiation - Use foot traffic insights and competitor density to negotiate favourable rental terms and ensure cost-effective store placement.
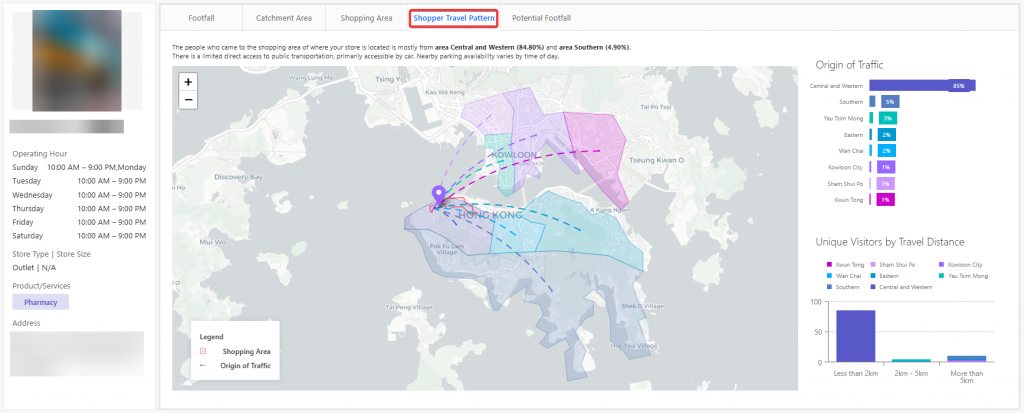
1.4 Shopper Travel Pattern
Shopper Travel Pattern Analysis displays where shoppers originate from when visiting the shopping areas around the store, visualized on a map. On the left, two graphs provide key insights: the top graph shows the percentage of traffic by origin, while the bottom graph presents unique visitors based on travel distance. If a significant number of shoppers travel more than 5km to visit, businesses may consider expanding their presence in those areas to capture demand.
Use Cases:
- Site Expansion Planning - Identify areas with high inbound traffic from distant locations to assess potential store expansion opportunities.
- Targeted Marketing Campaigns - Optimise marketing efforts by tailoring promotions to shoppers based on their travel distance and origin patterns.
- Store Accessibility Evaluation - Analyse visitor travel distances to determine if improvements in transportation access or additional store locations are needed.
1.5 Potential Footfall
This section provides a forecast of the store's potential footfall for the upcoming month based on previously collected footfall data and store profiling analysis. The dashboard helps businesses anticipate footfall trends influenced by demographic shifts, offering insights into the percentage of target vs. non-target demographics visiting the store. Additionally, the dashboard allowing businesses to assess profitability by comparing projected footfall with potential monthly sales and estimated operation cost.
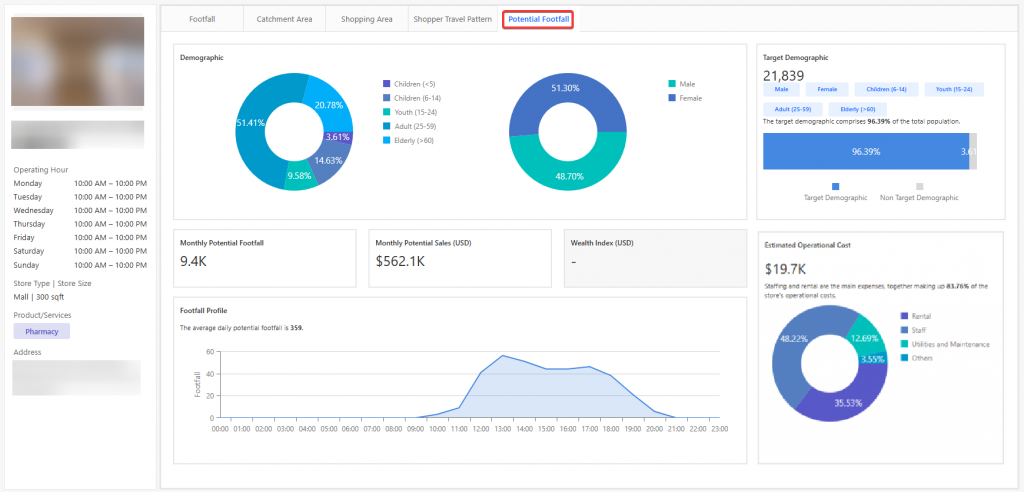
Use Cases:
- Sales & Revenue Forecasting - Predict monthly footfall to estimate potential sales and align revenue targets accordingly.
- Operational Cost Optimisation - Compare projected footfall and sales with estimated operating costs to ensure profitability and resource efficiency.
- Target Audience Analysis - Evaluate the percentage of target vs. non-target demographics to refine marketing and product strategies.
1.6 App Configuration
Users can access the App Configurations Section to add a test site or update site details. Sites created in V9 with allocated devices will automatically appear under the Site Section. To update site details, simply click on the respective site column and enter the necessary information.
1.6.1 How to Create New Site In App
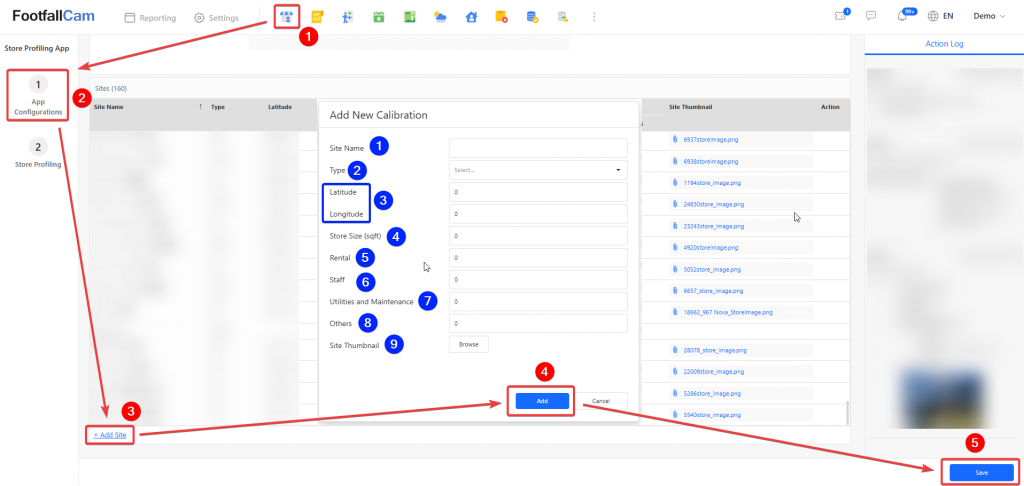
- Click on Store Profiling > App Configurations > Add Site button to create new site
- Fill in the relevant information for the required fields and click on the Add button and Save button.
| Item | Description |
|---|---|
| 1. Site Name | Enter a preferred name for the site. |
| 2. Type | Select the site type from the drop-down list. |
| 3. Latitude & Longitude | Input the geographical coordinates of the site. |
| 4. Store Size (sqft) | Specify the store's size in square feet. |
| 5. Rental | Enter the operational cost for rental. |
| 6. Staff | Enter the operational cost for staffing. |
| 7. Utilities and Maintenance | Input the cost for utilities and maintenance. |
| 8. Others | Add any additional operational costs not mentioned above. |
| 9. Site Thumbnail | Upload an image representing the site. |
Note:
- Type, Latitude, and Longitude are essential for store profiling analysis. Without them, the app won't be able to run mobile ping data and generate insights for Catchment Area, Shopping Area, and Shopper Travel Pattern.
- Store Size, Rental, Staff, Utilities, Maintenance, and Other Costs contribute to the operational cost estimation displayed in the Potential Footfall section.