This chapter will mainly describe about the dashboards and reports.
The differences between dashboards and reports are as below:
-
Dashboards: interactive but cannot be scheduled to send
-
Report: non-interactive but can be scheduled to send
4.1 Data Visualisation
4.1.1 Dashboard Catalogue
Below showed the full list of dashboard templates available, dashboard availability may vary depending on the company subscription plan, individual user account and their corresponding user group permissions.
|
Dashboard Name |
Purpose |
Audience |
| Footfall Overview Dashboard | To have an overview of the footfall trend (visitor count) across all sites | Store Manager |
| Live Occupancy Dashboard (Public View) | To review current occupancy of the site and whether it exceed the capacity | Visitor and store manager |
| Live Occupancy Dashboard (Staff View) | To review today's occupancy from start of operation until now | Store Manager |
| Store Performance Dashboard (Footfall and Demographics) | To review the store performance, including footfall, busiest hours, and demographics. | Store Manager |
| Store Performance Dashboard (Footfall and In-store Analytics) |
To review the store performance, including footfall, busiest hours, and engagement rate. Allow managers to set strategies to achieve targeted KPI. | Store Manager |
| Store Performance Dashboard (Footfall and Sales) |
To review the store performance, including footfall, busiest hours, and sales conversions. | Store Manager |
| Store Performance Dashboard (Footfall) | To review the store performance and set strategy in order to achieve targeted KPI | Store Manager |
| Store League Table | To compare performance across different sites, facilitating strategic decision-making to optimize operations and drive profitability | Store Manager |
| Building Performance Dashboard | To review the shopping mall performance and arrange facilities accordingly | Mall Manager |
| Customer Engagement Dashboard | To identify engagement of each zone, allowing strategic product placement to enhance customer interaction and sales | Store Manager |
| Visitor Count and Occupancy Dashboard | To have a comprehensive view of visitor dynamics and space utilisation for resources allocation | Store Manager |
| Queue Performance Dashboard | To have overview of queue wait time and arrange resources accordingly | Store Manager |
| Live Occupancy Floorplan Dashboard | To identify which zone has high or low engagements based on the duration visitors stay within the zone, allowing strategic product placement for enhancing customer interaction and sales |
Store Manager |
| Session-based Footfall Analytics Dashboard |
To analyse visitor trends, optimise space utilisation, enhance management, and make data-driven decisions for improved operational efficiency and visitor satisfaction |
Store Manager |
| Zone Footfall Analytics Dashboard |
To explore daily and hourly trends in zone-specific footfall and visit duration within the selected site |
Store Manager |
| Airport Live Queue Monitoring Dashboard |
To have an overview of the queue waiting time at the airport. Allows managers to enhance services based on the live data. Managers will be notified when the queue time exceeds the preset benchmark |
Airport Manager |
| Airport Live Passenger Flow Dashboard |
To have an overview of the passenger flow at the airport. This includes the average waiting time and number of queuing passengers in each area. |
Airport Manager |
| Real Time Entrance Traffic Monitoring Dashboard |
To have an overview of the real time traffic by comparing the current occupancy with the capacity. Managers will be notified if the current occupancy has breached the capacity. Suitable for indoor events. |
Event Manager |
4.1.2 Report Catalogue
Below showed the full list of report templates available, report availability may vary depending on the company subscription plan, individual user account and their corresponding user group permissions.
|
Level of Reporting |
Report Name |
Industry |
Usage |
| Regional Level | Regional Footfall Report (Daily) | Retail Store | To showcase the daily trend across all branches based on a compiled daily report for macro view across all stores in the chain and drill down to an individual store in question if performance drops. |
| Regional Footfall Report (Weekly) | Retail Store | To showcase the overall weekly trend across all branches within the company and provide all C-level executives with a comprehensive insight on the consumer behaviors and have a macro view of the performance of the stores. | |
| Regional Footfall Report (Monthly) | Retail Store | To showcase the overall trend across the previous month for all branches within the company. Provide all C-level executives with a comprehensive insight on the consumer behaviors and have a macro view of the performance of the stores. | |
| Regional Sales Report (Daily) | Retail Store | To showcase the daily sales trend across all branches based on a compiled daily report for macro view across all stores in the chain. Able to compare performance of each store and allocate resources accordingly. | |
| Regional Sales Report (Weekly) | Retail Store | To showcase the overall weekly sales trend across all branches within the company and provide all C-level executives with a comprehensive insight on the consumer spending behaviors and have a macro view of the performance of the stores. | |
| Regional Sales Report (Monthly) | Retail Store | To showcase the overall sales trend across the previous month for all branches within the company. Provide all C-level executives with a comprehensive insight on the consumer spending behaviors and have a macro view of the performance of the stores. | |
| Site Level | Store Footfall Report (Daily) | Retail Store | To showcase the daily trend across the site and have a macro view of the performance of the site. |
| Store Footfall Report (Weekly) | Retail Store | To showcase the overall trend across the week and provide a comprehensive insight on the consumer behaviors and have a macro view of the performance of the site. | |
| Store Footfall Report (Monthly) | Retail Store | To showcase the overall trend across the previous month and provide a comprehensive insight on the consumer behaviors and have a macro view of the performance of the site. | |
| Store Sales Report (Daily) | Retail Store | To showcase the daily sales trend across the site and have a macro view of the performance of the site. | |
| Store Sales Report (Weekly) | Retail Store | To showcase the overall sales trend across the week and provide a comprehensive insight on the consumer spending behaviors and have a macro view of the performance of the site. | |
| Store Sales Report (Monthly) | Retail Store | To showcase the overall sales trend across the previous month and provide a comprehensive insight on the consumer spending behaviors and have a macro view of the performance of the site. | |
| Mall Footfall Report (Daily) | Shopping Mall | A daily run through of the performance of the shopping mall in comparison of the previous day. Management can implement better personnel allocation based on the peak traffic in area. | |
| Mall Footfall Report (Weekly) | Shopping Mall | To showcase the overall trend across the week and provide a comprehensive insight on the consumer behaviors of the shopping mall. | |
| Mall Footfall Report (Monthly) | Shopping Mall | With monthly insight into the shopping mall performance, overseers and developers will have analytical insight into the total visitor count of their mall and to quantify customer loyalty in certain areas or zones. | |
| Area Level | Area Footfall Report (Daily) | Retail Store/Shopping Mall | A daily run through of the performance of the store or shopping mall focusing on different areas. The area type includes Floor Level/Zone/Mall or Store Entrance. Management can implement better personnel allocation based on the peak traffic in the area. |
| Area Footfall Report (Weekly) | Retail Store/Shopping Mall | To showcase the overall trend across the week and provide a comprehensive insight into consumer behaviors focusing on different areas. The area type includes Floor Level/Zone/Mall or Store Entrance. Management can implement better personnel allocation based on the peak traffic in the area. | |
| Area Footfall Report (Monthly) | Retail Store/Shopping Mall | With monthly insight into the store or shopping mall performance, overseers and developers will have analytical insight into the total visitor count in each area and quantify customer loyalty in certain areas or zones. |
4.1.3 Analytics Widget
Analytics widget is designed to enable data analysts to easily access for data comparison, across different granularity, metrics, and period. Multiple workspaces and datasets are provided for various use cases.
Dataset
Dataset is a set of data with specific granularity and metrics, designated to be used in analytics. For more information you may refer here.
Analytics Widget
|
Widget Name |
Description |
| Hourly Data Analytics | To compare desired entity across the same metric at the same period by hour. |
| Time Series Comparison | To compare the same metric across different time periods |
| Entity Comparison | To compare the different entities (e.g. Site A compare Site B, or Area A compare Area B) across the same metric and same period. |
| Metric Comparison | To compare different metrics across same time period and same entity |
| Before and After Event Comparison | To compare the metrics before the event, during the event and after the event. |
| Pivot Table | To compare data across entities, metrics and time intervals by customising the row, column and series. |
| Heatmap Table | To analyse the metric by comparing time vs time or time vs entity. |
| Trend Analytics | To analyse the trend of selected entity and metric over specific periods making it easier to observe seasonality pattern. |
4.2 Rules Engine
4.2.1 Rule Settings
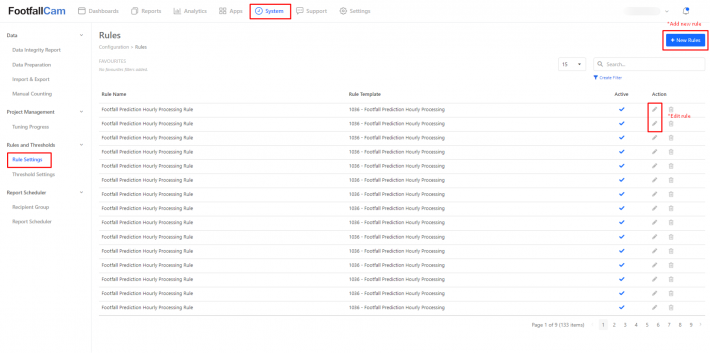
Step 1 - After login to v9.footfallcam.com, go to System -> Rules and Thresholds -> Rule Settings.
Step 2 - Click "+ New Rules" and select rule type. Then, click the Create button to add new rule.
Step 3 - If you want to edit the rule, search for the rule and press the pencil icon. It will direct you to another page for editing.
For more information you may refer here.
4.2.2 Threshold Settings
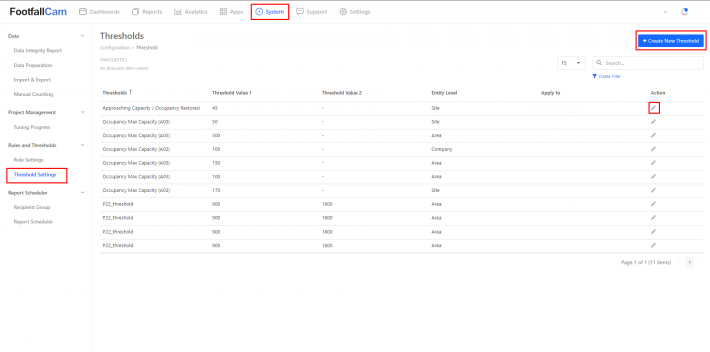
Step 1 - After login to v9.footfallcam.com, go to System -> Rules and Thresholds -> Threshold Settings.
Step 2 - Search for the threshold that you want to edit and press the pencil icon.
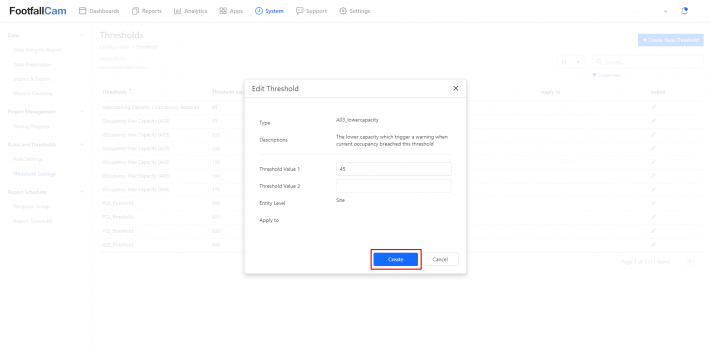
Step 3 - It will prompt out an edit window for you to change the Threshold Value 1 and press Create and the threshold will be updated.
4.2.3 Create New Threshold
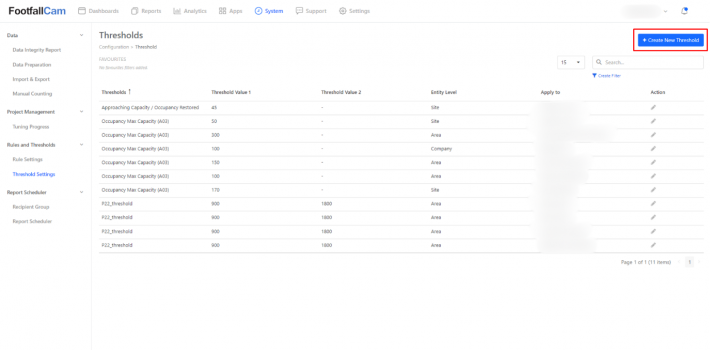
Step 1 - Click Create New Threshold. It will prompt out a window for you to create a threshold.
Step 2 - Select the threshold type and enter threshold value(s).
Step 3 - Select Entity Level and choose the site/area/company in Apply to. Then, click the Create button.
Threshold
|
Threshold Name |
Description |
| Cleaning SLA | The SLA, in second, which trigger an alert when the washroom cleaning task breached this threshold. |
| Queue Length Max Capacity | The maximum capacity which trigger an alert when current queue length breached the threshold. |
| Min Queue Serve Duration | The minimum duration in second, to consider as a serving customer. |
| Visit Duration Scaling | The scaling for visit duration, default as 1. |
| Returning Rate Scaling | The scaling for returning rate, default as 1. |
| Washroom Usage Max Capacity | The maximum usage which trigger an alert when the current washroom usage breached this threshold. |
| Min Duration for Engagement | The minimum duration in second, to consider as an engaged customer. |
| Visit Duration Distribution 1 | Number of visitors with dwell time within [Value,Value2) in seconds. |
| Visit Duration Distribution 2 | Number of visitors with dwell time within [Value,Value2) in seconds. |
| Visit Duration Distribution 3 | Number of visitors with dwell time within [Value,Value2) in seconds. |
| Visit Duration Distribution 4 | Number of visitors with dwell time within [Value,Value2) in seconds. |
| Visit Duration Distribution 5 | Number of visitors with dwell time within [Value,Value2) in seconds. |
| Engaged Duration Distribution 1 | Number of engaged customers with engaged duration within [Value,Value2) seconds. |
| Engaged Duration Distribution 2 | Number of engaged customers with engaged duration within [Value,Value2) seconds. |
| Engaged Duration Distribution 3 | Number of engaged customers with engaged duration within [Value,Value2) seconds. |
| Engaged Duration Distribution 4 | Number of engaged customers with engaged duration within [Value,Value2) seconds. |
| Engaged Duration Distribution 5 | Number of engaged customers with engaged duration within [Value,Value2) seconds. |
| Sudden Surge in Footfall | When the footfall exceed this threshold within the duration set in Visitor IN Monitoring rule, consider a sudden surge and trigger an alert. |
| Exceeded Predicted Footfall (Percentage) | When the difference in percentage between actual footfall and predicted footfall exceed this threshold within the duration set in Visitor IN Monitoring rule, consider a huge increased and trigger an alert. |
| Approaching Capacity / Occupancy Restored | The lower capacity which trigger a warning when current occupancy breached this threshold. |
| Occupancy Max Capacity (A03) | The maximum occupancy capacity for the enclosed region, which trigger an alert when current occupancy breached this threshold. |
| Wait Time Threshold / P22_threshold | Minimum duration in second, to consider queue wait time as busy. |
| Queue Wait Time Distribution 1 | Time interval [Value,Value2) for queue wait time distribution in seconds. |
| Queue Wait Time Distribution 2 | Time interval [Value,Value2) for queue wait time distribution in seconds. |
| Queue Wait Time Distribution 3 | Time interval [Value,Value2) for queue wait time distribution in seconds. |
| Queue Wait Time Distribution 4 | Time interval [Value,Value2) for queue wait time distribution in seconds. |
| Queue Wait Time Distribution 5 | Time interval [Value,Value2) for queue wait time distribution in seconds. |
| Group Size Distribution 2 | Interval for group size distribution. |
| Group Size Distribution 3 | Interval for group size distribution. |
For more information you may refer here.
4.3 Custom Dashboard
4.3.1 Custom Dashboard Building
- Go to one of the analytics widget. Eg. Time Series Comparison
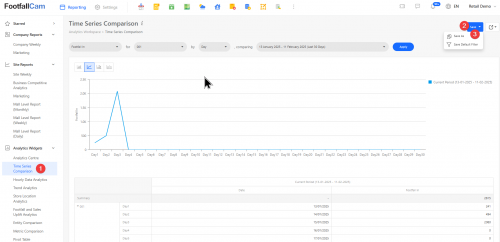
- Select desired site, metric and date.
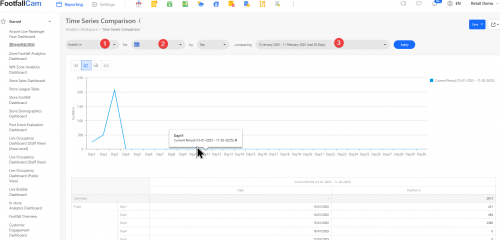
- Click on Save as and named your widget.
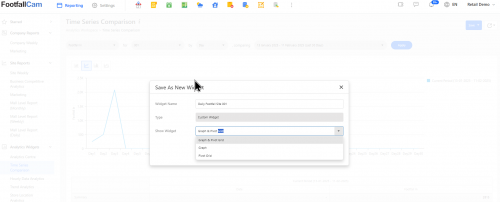
- Go to All Dashboard > Click on New Dashboard
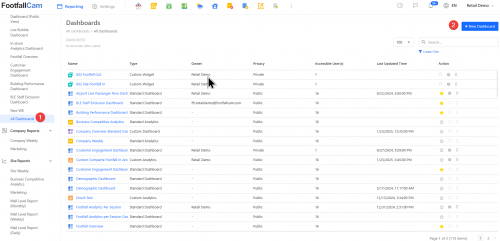
- Fill in your dashboard name and select type as Custom Analytics.
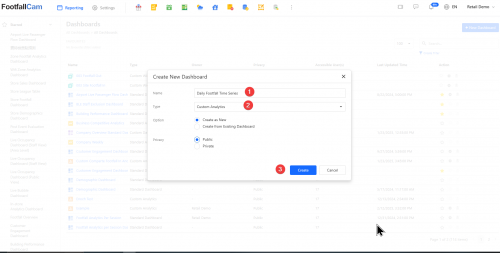
- Click on switch to designer > select widget icon on the left side bar.
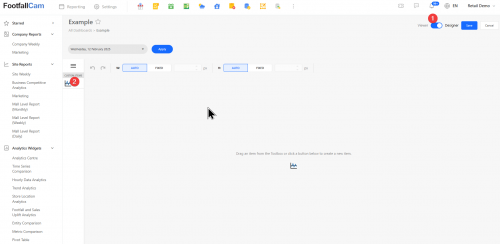
- Click on option and select the widget that you saved.
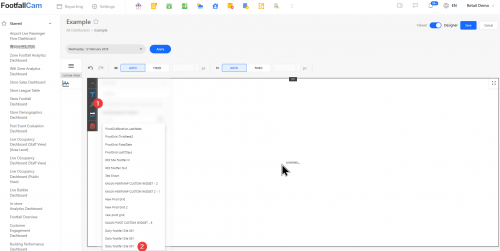
- Click Save and refresh.
Note : All analytics widget can be saved except Analytics Centre ,Store Location Analytics , Footfall and Sales Uplift Analytics

