Metric comparison widget allows data analysts to compare different metrics across same time periods and same entity.
When a dataset is selected, some default value will be set and render the basic widget. Data analysts may update the selectors accordingly to achieve the desired analysis.
Introduction

Metric comparison widget is used to analyse the targeted metrics for the desired entity by selected time resolution, comparing for the same period.
[1] Entity
The entity list will display all available sites / site groups / areas / area groups based on the dataset and granularity selected. You may select the desired entity or select all in a group for comparison
[2] Metric
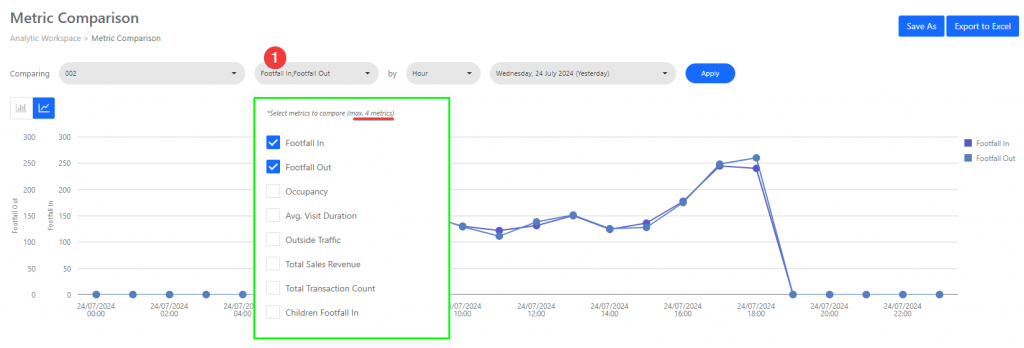
The metric available will be dependent on the dataset selected. Kindly refer here for the full list of dataset available. You may select up to 4 metrics for comparison.
[3] Time Resolution
Time resolution decides the interval for x-axis. In our system it comes with hour, day, week, month and year.
[4] Period
The time series period is ready with relative date range and compared period.
Relative Date Range
Relative date range is dynamic time interval in relation with today, for our system, we ready with compare period of preceding period and preceding year.
| Type | Current Period | Compared Period |
| Day | Today Yesterday |
Preceding day Same day last week Same day last year |
| Week | Last 7 days including today This week Last week |
Preceding period Preceding year |
| Month | Last 30 days including today This month Last month |
Preceding period Preceding year |
| Custom | Custom date range | Custom date range |
Metric comparison widget also comes with bar chart display mode, data analysts may change the chart type using the toggle at the top left corner.

Use Case
Metric comparison allows user to compare different metric across the same period and same entity. For showcase purpose, we will be using the following setup as example:
Entity: Site
Metrics: [PFC01_11] Footfall Count IN_Visitor People, [PFC02_11] Footfall Count OUT_Visitor_People
Time Resolution: Hour
Restriction
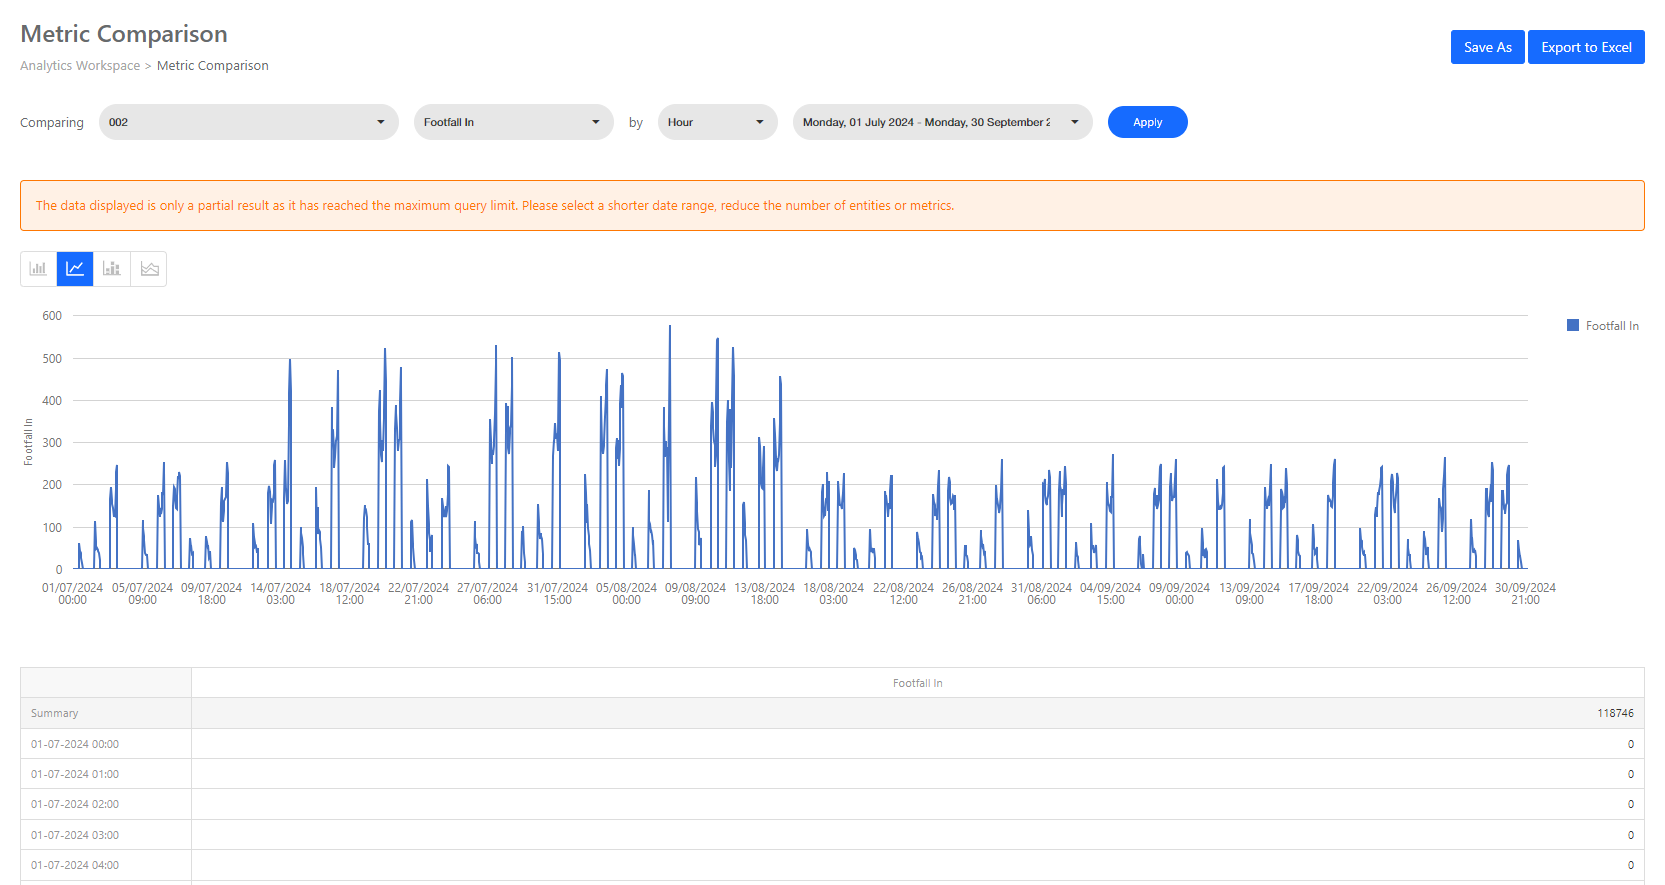
To ensure optimal performance and prevent data processing delays, the Time Series Comparison widget has a maximum query limit of 50,000 records.
Important Information:
- Partial Results: When the maximum query limit is reached, the data displayed will only be a partial result set. This means that the chart and pivot table may not show all possible data points for the selected query.
- Recommendation: To obtain complete and accurate data, please adjust your query parameters by:
- Selecting a shorter date range.
- Reducing the number of entities.
- Limiting the metrics included in the query.

