


Store Location Analysis App helps businesses evaluate whether their new or existing stores are attracting the right target audience. By leveraging population data collected via mobile ping data--sourced from platforms like Facebook or through partnerships with telecom companies--retailers can gain insights into foot traffic patterns, demographic distribution, and customer behaviour. This data-driven approach ensures informed decision-making for site selection, market expansion, and store optimization.
1.1 Catchment Area
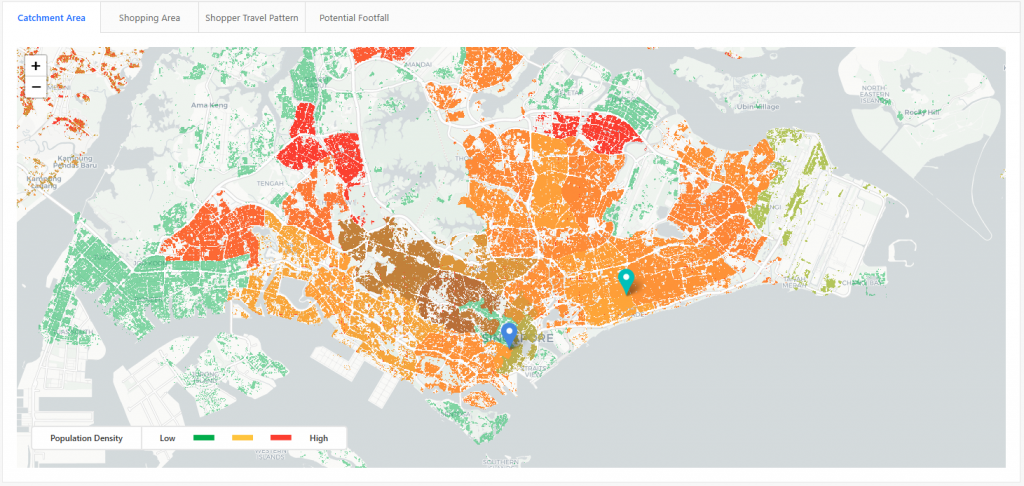
A catchment area refers to the geographic zone from which a store attracts the majority of its customers. It is crucial for store location analysis as it helps businesses determine the best locations to maximize footfall and revenue.
In the map, population density is categorized using a color scale--green for low density, yellow for medium, and red for high density. Typically, management prefers opening stores in high-density areas (red zones) to ensure greater customer traffic.
This analysis provides businesses with a nationwide population density overview, helping them make data-driven decisions on store placement. Additionally, stores are pinned on the map, allowing for a clear visual representation of their proximity to high-density areas.
1.2 Shopping Area
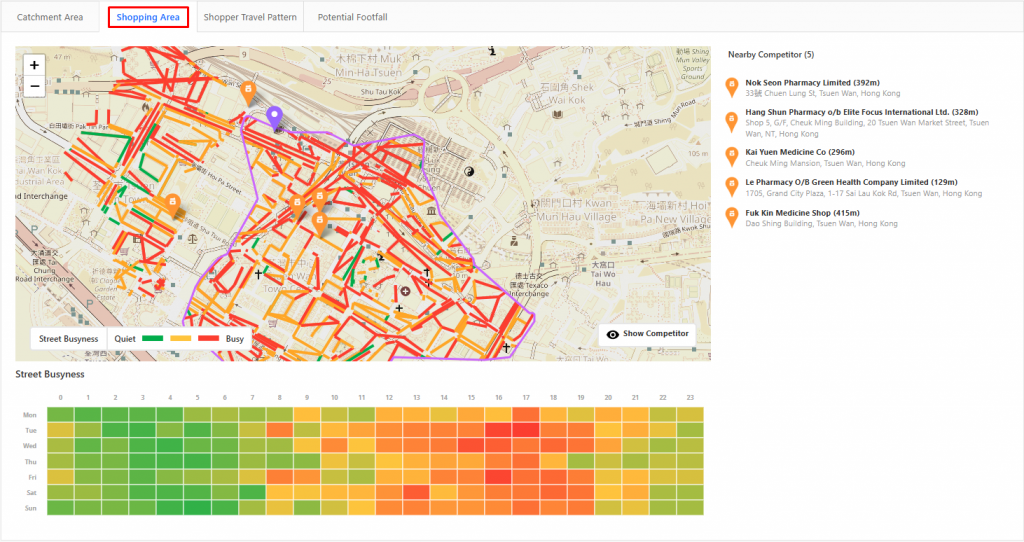
In the shopping area section, we refine the analysis by zooming into the streets surrounding the store location. This section provides a detailed view of street activity, using a color scale to indicate busyness--helping businesses understand foot traffic patterns near their store.
Additionally, the map highlights nearby competitors, offering valuable insights into market competition.
Below the map, a table displays hourly street busyness from Monday to Sunday, enabling businesses to identify peak shopping hours and optimize store operations accordingly.
1.3 Shopper Travel Pattern
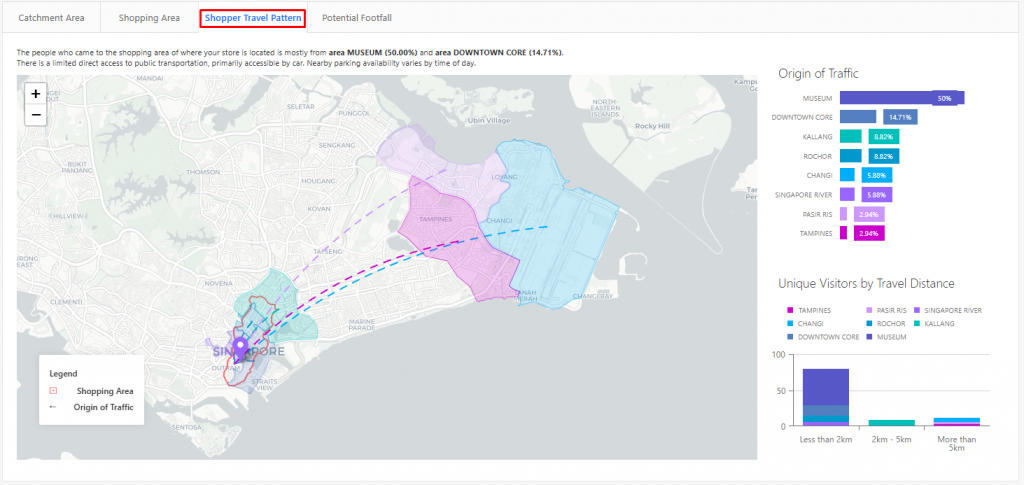
In the Shopper Travel Pattern section, the map primarily displays where shoppers are coming from and highlights the shopping areas around the store.
To the right of the map, there are two key insights:
- Traffic Origin Breakdown - The top section presents the percentage of visitors coming from different areas, helping businesses understand where their customers are concentrated.
- Visitor Travel Distance - The bottom section features a bar chart categorizing visitors based on their travel distance:
- Less than 2km (local shoppers)
- 2km-5km (nearby neighborhoods)
- More than 5km (regional visitors)
This data helps businesses assess store accessibility and refine marketing strategies to better target their customer base.
1.4 Potential Footfall
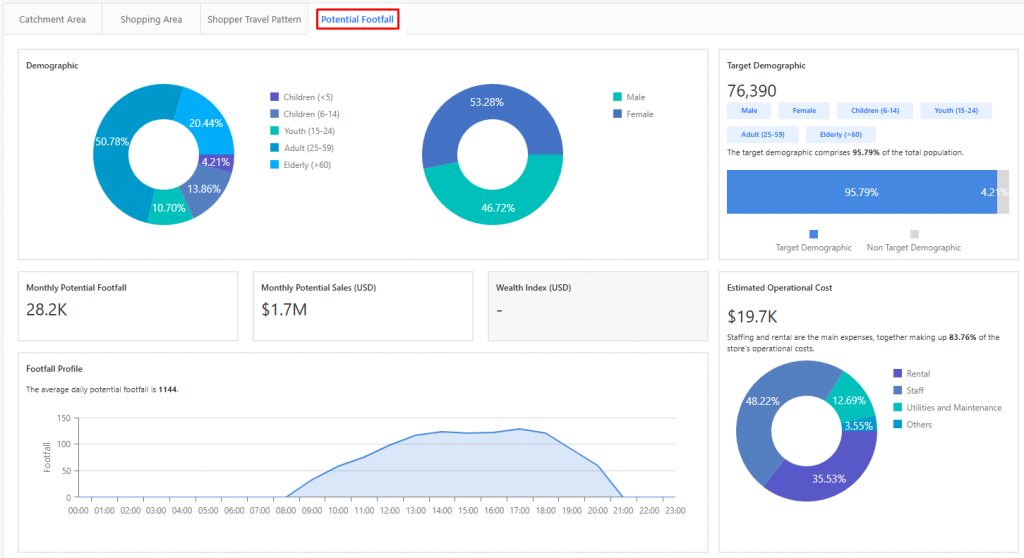
This section provides key insights into the potential customer base around the store location through various data visualizations:
- Demographics Analysis
- Displayed using two donut charts: one for age groups and one for gender distribution.
- On the right side, businesses can set their target demographic, and below, a bar chart indicates:
- Percentage of total population matching the target demographic
- Percentage of non-target demographic
- Key Business Metrics
- Monthly Potential Footfall
- Monthly Potential Sales (displayed in the local currency)
- Wealth Index (displayed in the local currency)
- Operational Cost Estimation
- A donut chart at the bottom right provides an estimated operational cost breakdown.
- Average Daily Footfall Profile
- An hourly breakdown of foot traffic, helping businesses identify peak and off-peak hours.
This section helps businesses evaluate the feasibility and profitability of a store location based on customer demographics, financial potential, and operational costs.
1.5 App Configuration
To set up a site in the Store Location Analysis App, follow these steps:
- Log in to FootfallCam Analytic Manager V9™ via this link using Google Chrome.
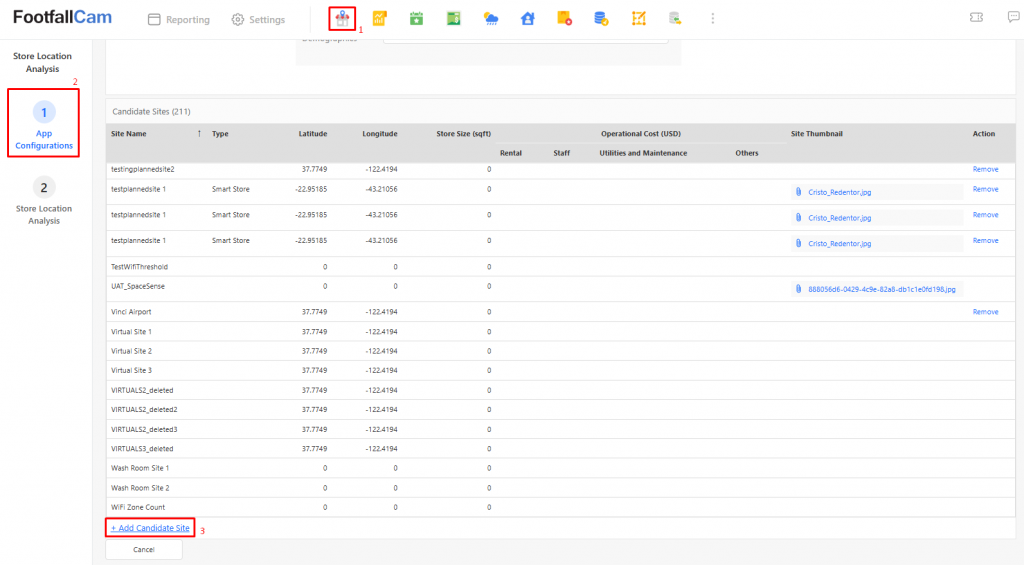
- Click on the Store Location Analysis App Icon located on the top bar.
- Navigate to App Configurations.
- Scroll down to the Candidate Site section and click + Add Candidate Site.
This will allow you to add and configure a new store location for analysis.
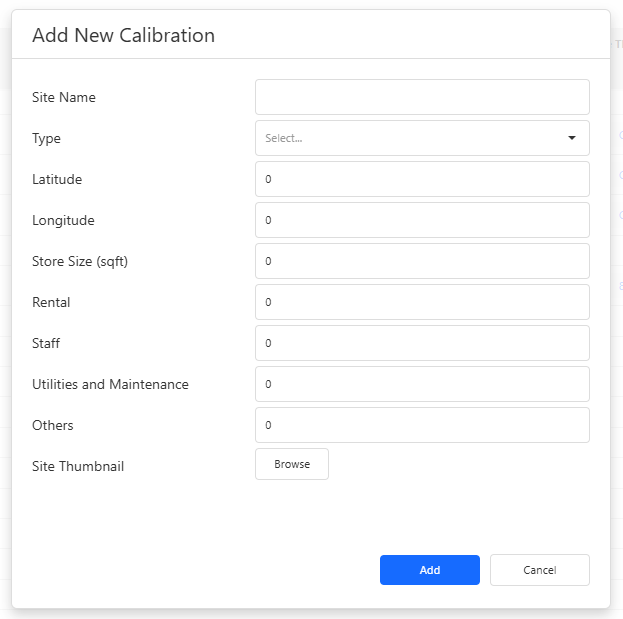
After clicking + Add Candidate Site, a table will pop up for you to enter the necessary details:
- Site Name - We recommend using a name that is easy to recognize and identify the store.
- Type, Latitude, and Longitude - These are essential for store location analysis. Without them, we won't be able to run mobile ping data and generate insights for Catchment Area, Shopping Area, and Shopper Travel Pattern.
- Store Size, Rental, Staff, Utilities, Maintenance, and Other Costs - These details contribute to the operational cost estimation shown in the Potential Footfall section.
- Site Thumbnail - Optional but preferable for better visualization.
Ensure all necessary details are filled in for accurate analysis and insights.