Trend Analytics widget allows data analysts to analyse the trend of selected entity and metric over specific periods across all time data, making it easier to observe seasonality pattern.
When a dataset is selected, some default value will be set and render the basic widget. Data analysts may update the selectors accordingly to achieve the desired analysis.
Introduction
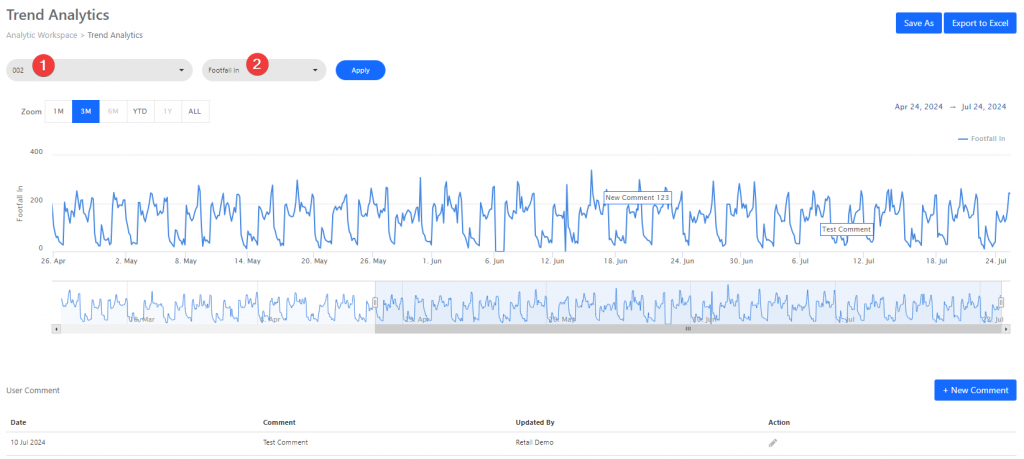
[1] Entity
The entity list will display all available sites / site groups / areas / area groups based on the dataset and granularity selected. You may select the desired entity or select all in a group for comparison
[2] Metric
The metric available will be dependent on the dataset selected. Kindly refer here for the full list of dataset available.
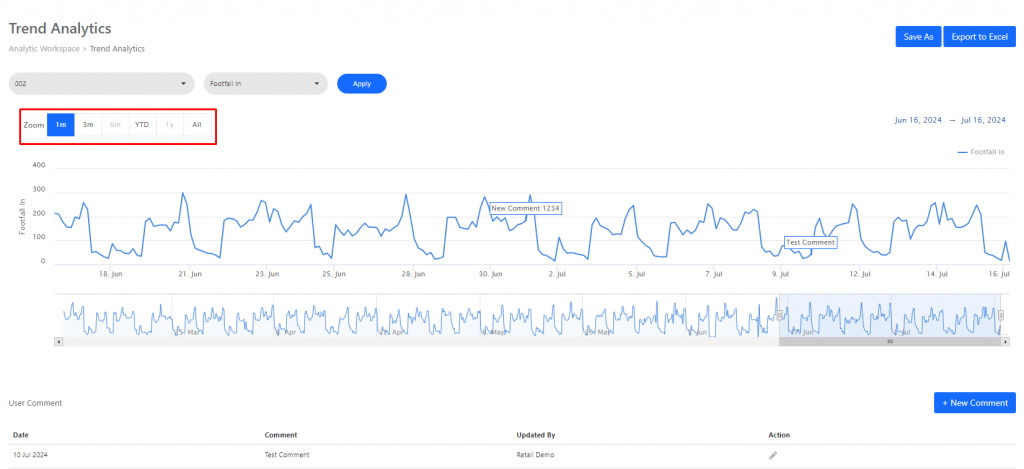
Data analysts may choose to zoom the data into different time period to observe them more clearly.
Comment Grid
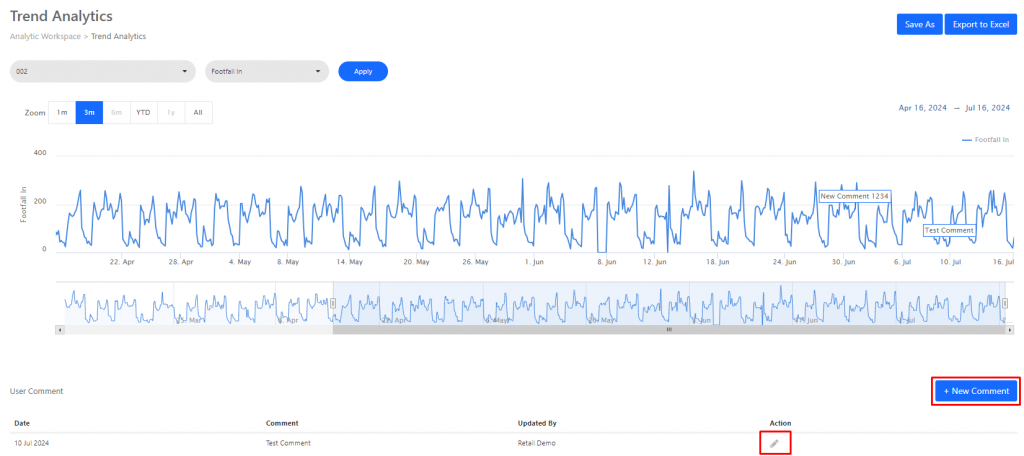
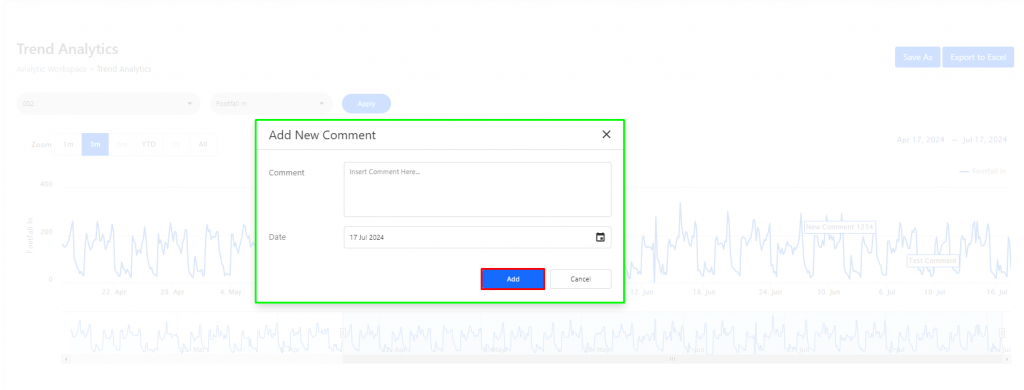
Data analyst may add new comment, edit existing comment and delete existing comment. After performing this action, it will auto add or remove flag in the chart immediately.
Export to Excel Function
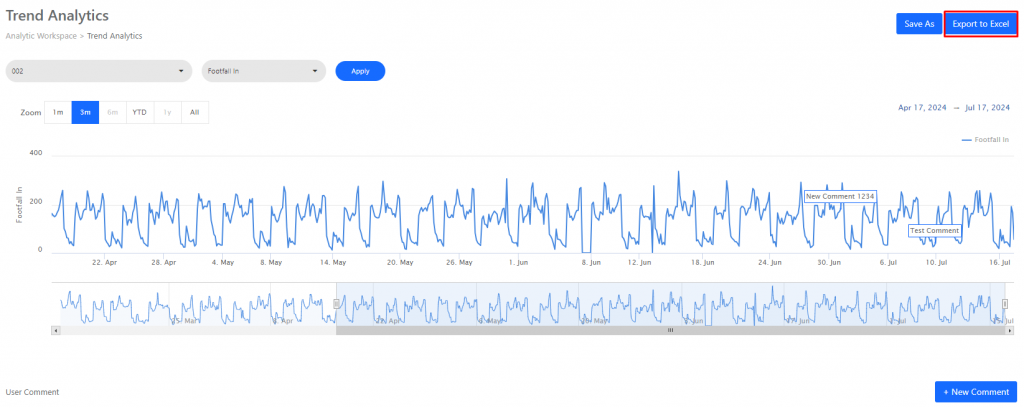
Data analyst may export current selection data to excel. The data will show in 3 columns, which are Date/Time, [Metric Name] and Comment.
Restriction
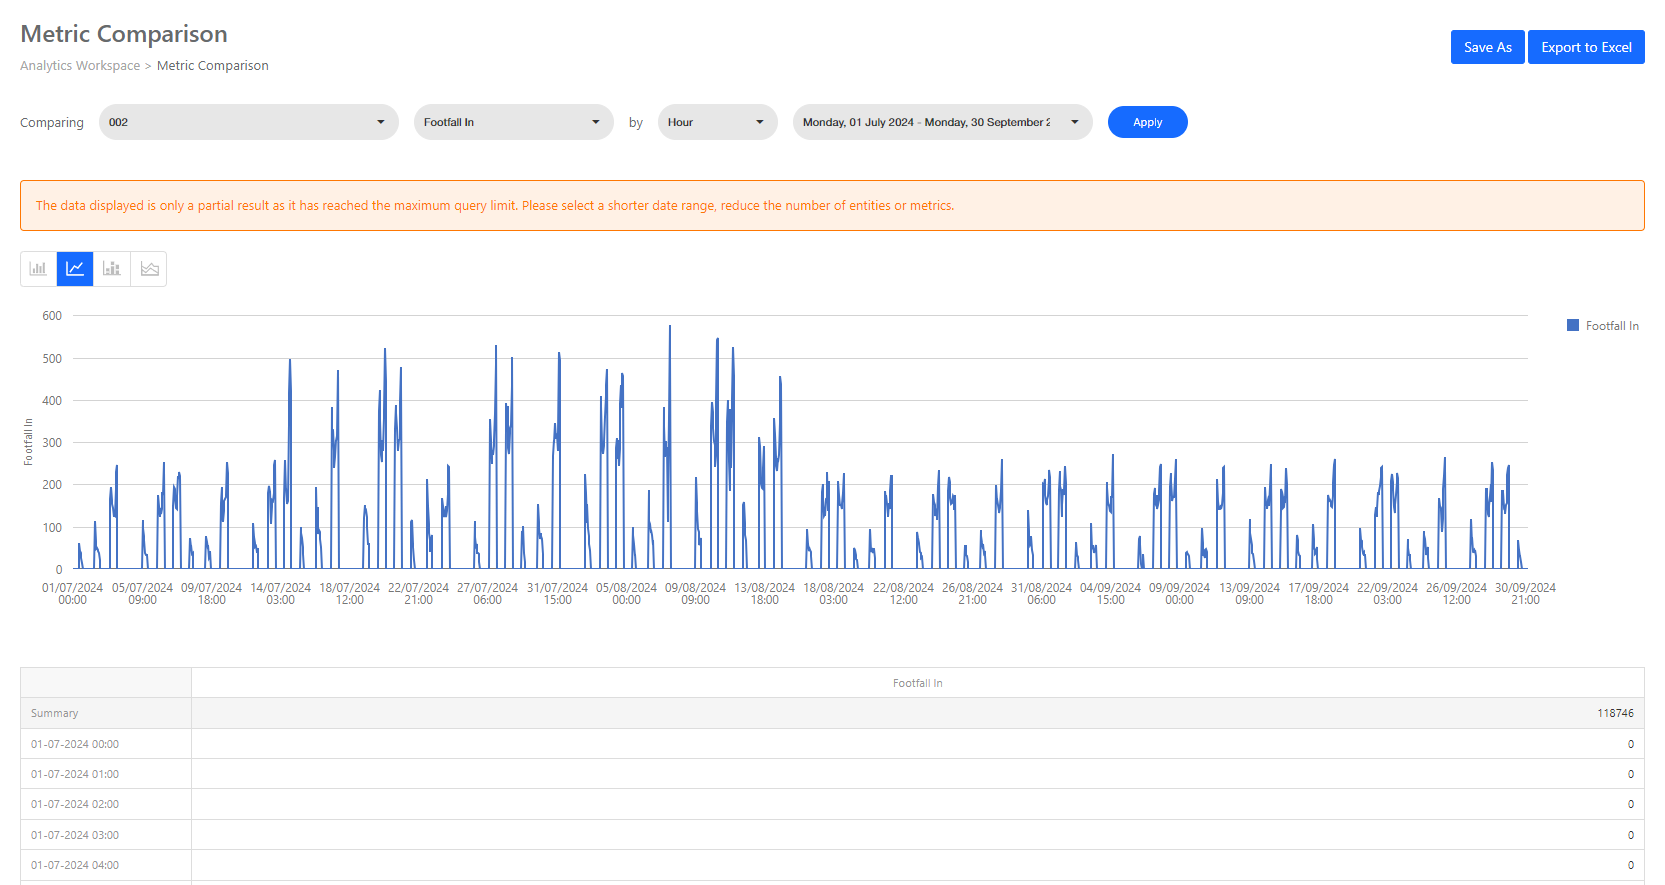
To ensure optimal performance and prevent data processing delays, the Trend Analytics widget has a maximum query limit of 50,000 records.
Important Information:
- Partial Results: When the maximum query limit is reached, the data displayed will only be a partial result set. This means that the chart and table may not show all possible data points for the selected query.
- Recommendation: To obtain complete and accurate data, please adjust your query parameters by:
- Selecting a shorter date range.
- Reducing the number of entities.
- Limiting the metrics included in the query.

