-
Industries
Industries
-
-
Products
Products
-
Software
FootfallCam V9™Enterprise class software platform
FootfallCam V9 Extension™Add more functionalities to V9
Services
Professional ServicesSystem deployment & optimisation service
CareGet the right level of support
Legacy CareIntegrate data from existing devices

Product Selector
Select the right product

People Counter Calculator
Number of devices required

Coverage & Clearance Calculator
Find out the ideal mounting position

Floor Plan Designer
Design your ideal solution
-
-
Supports
Supports
-
Start your journey, exploring devices, data, and complete solutions!

Support on devices, software, analytics and insights.

Offers support for customised solutions.

-
-
Partners
Partners
-
Offering on-site visits, installation, and local maintenance services.
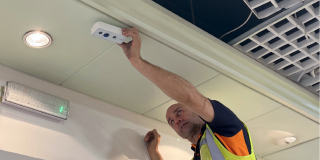
Engaging in local marketing, project-managing deployments.

Integrated solutions via strategic partnerships for products & services.

-
-
Company
Company
-
About FootfallCam
BlogsNewsroom
Join Our TeamCareers
-
- Buy Now Buy Now
- Contact Us Contact Us
- Portal Login Portal Login
Business Reporting
Footfallcam provide an overview and some of the guidelines on analyzing the data set and metrics in our standard control panel. It is designed for retail store’s manager and executives to gain deep insights into the aspects such as operation, marketing and customer profiles.
Reports for all Industries
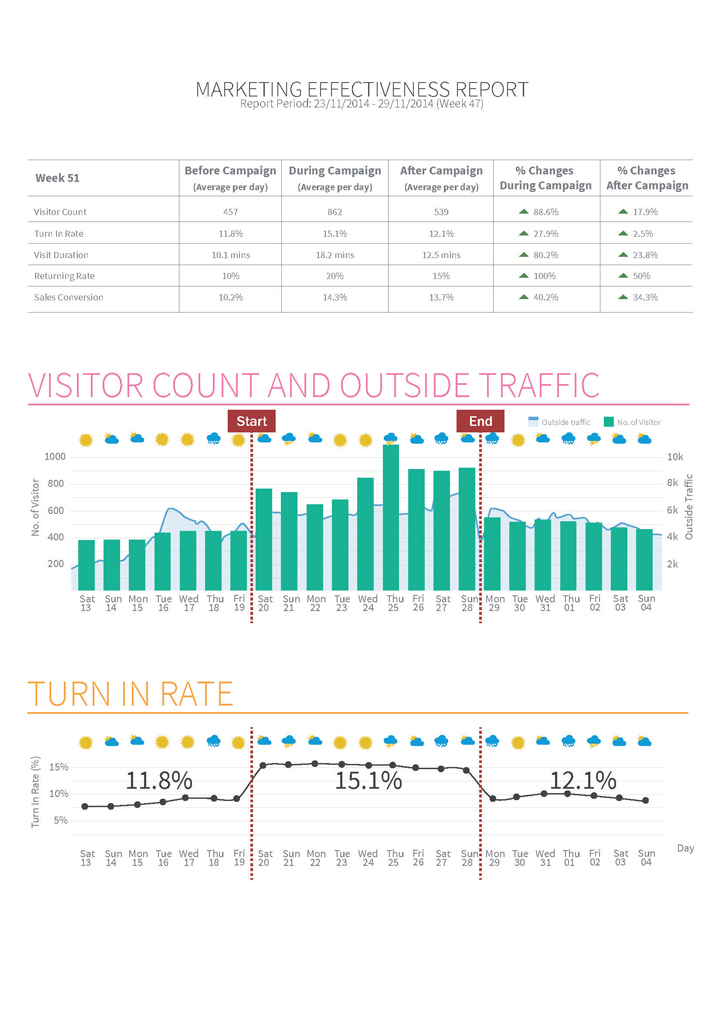
Marketing Effectiveness Report
This report can be used to measure the effectiveness of the marketing campaign for the retail stores. This further can help the management to make important sales decision such as whether more promotion campaign is required. The benchmark of the report are as below:
Visitor Count
Turn in rate
Visit Duration
Returning Rate
Sales Conversion
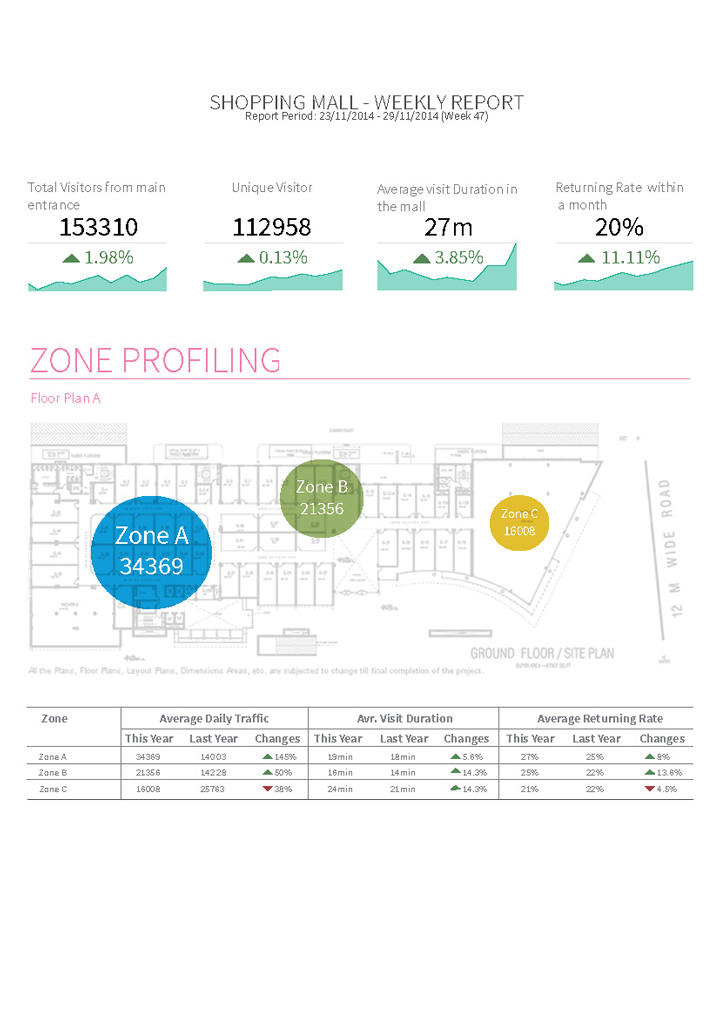
Zone Analytics Report
Zone analytics report helps to analyst the visitor profiling in a specific zone and how long they stay within the entities.
Visitor’s behaviour can be analysed in different zone to gain more insight. Instant comparison for each zone and visualisation of the traffic pattern at different areas of the entities.
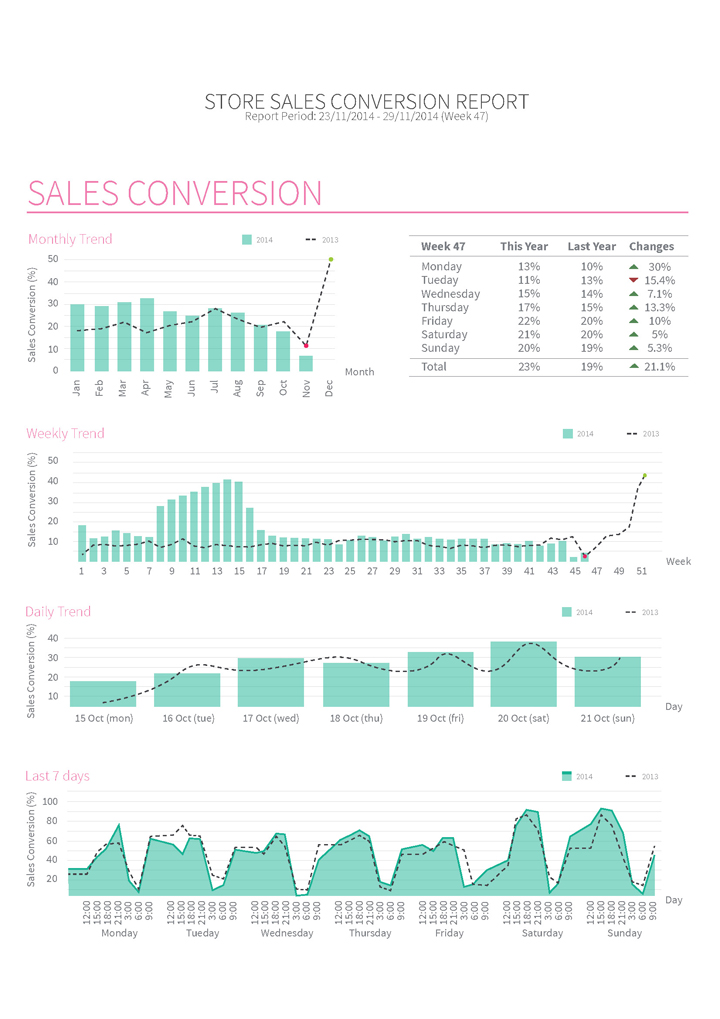
Sales Conversion Report
Sales conversion report allows the users to understand the relationship between the traffic and the sales volume. Managers or other report users can see the monthly, weekly and historical trend of the number of data which then integrate with the sales volume information to compose sales conversion rate.
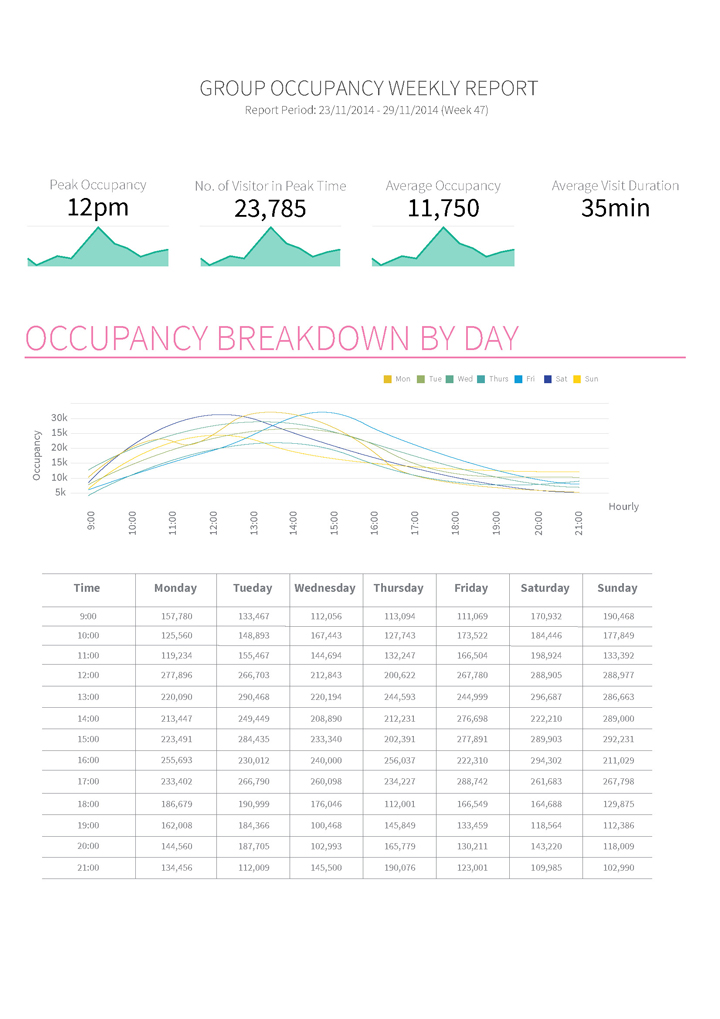
Occupancy Report
Footfall data can formulate occupancy report which can assist the management to better manage their occupancy level. This can be utilised to identify the impacts of any marketing events by the number of people entering the sites. Staffs allocation can be arranged in a better way and maintenance activities can be scheduled when the visitors numbers are relatively low.
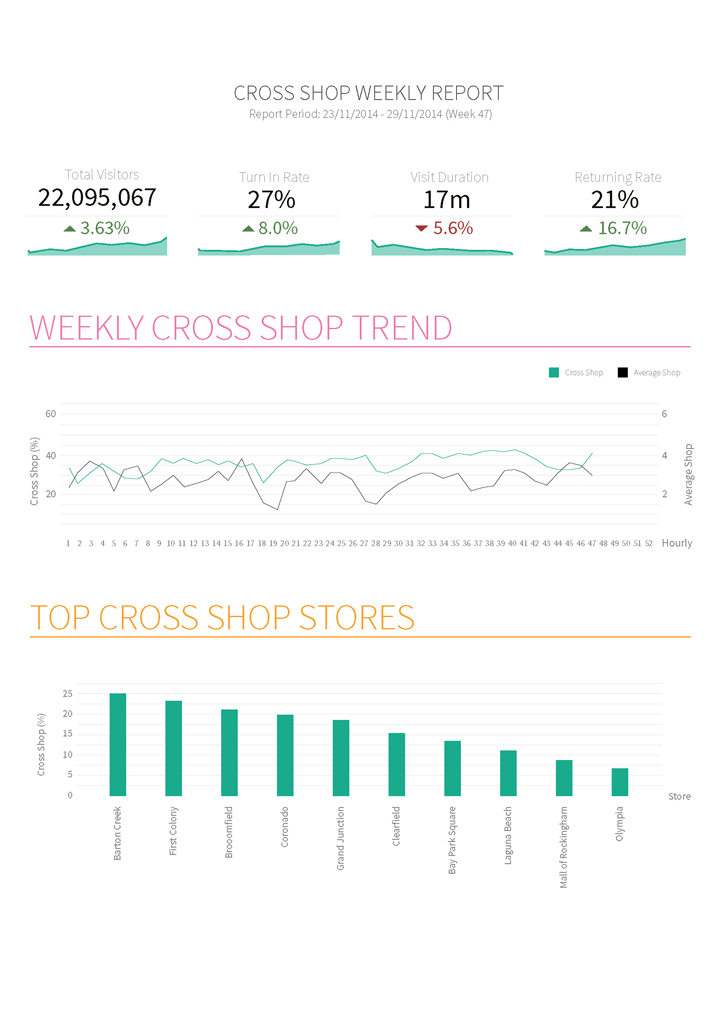
Cross Shopping Report
FootfallCam 3D+Wifi gathers MAC address to distinguish individual visitor. By comparing the unique identifier in different stores, cross shoppers can be identified. Whether customers travel to visit different stores due to holiday or shortage in the regular store can be found out through the report.
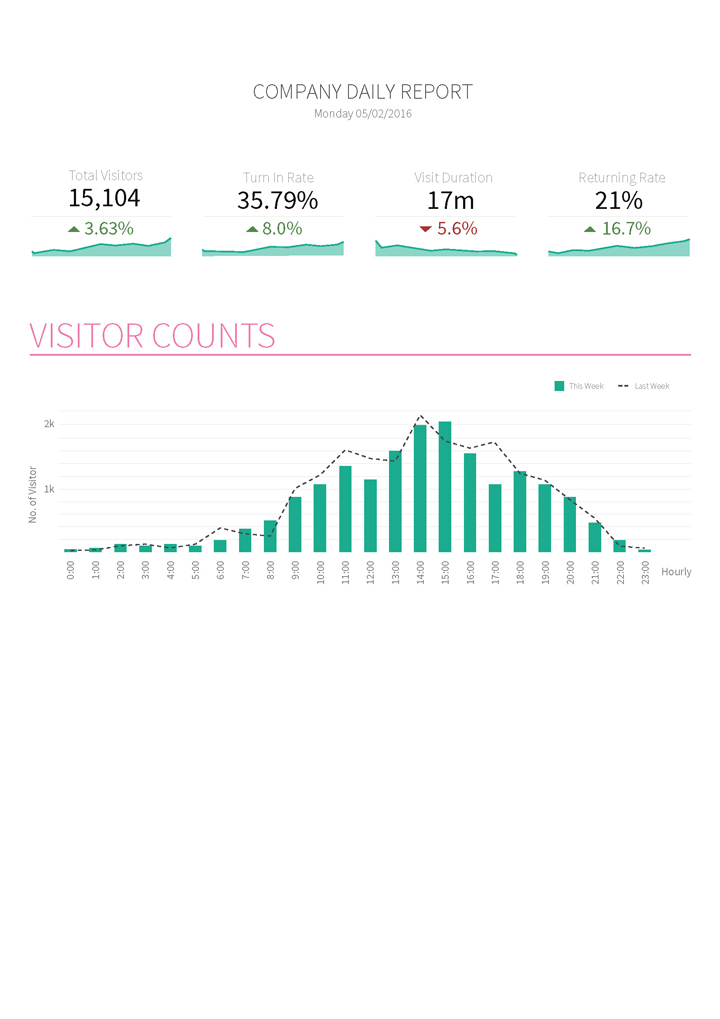
Company Daily Report
Based on the footfall data collected by our counter, you can see your store or company daily footfall report. The report reflects total visitors in a day, turn in rate, visit duration and also the returning rate for the visitors.
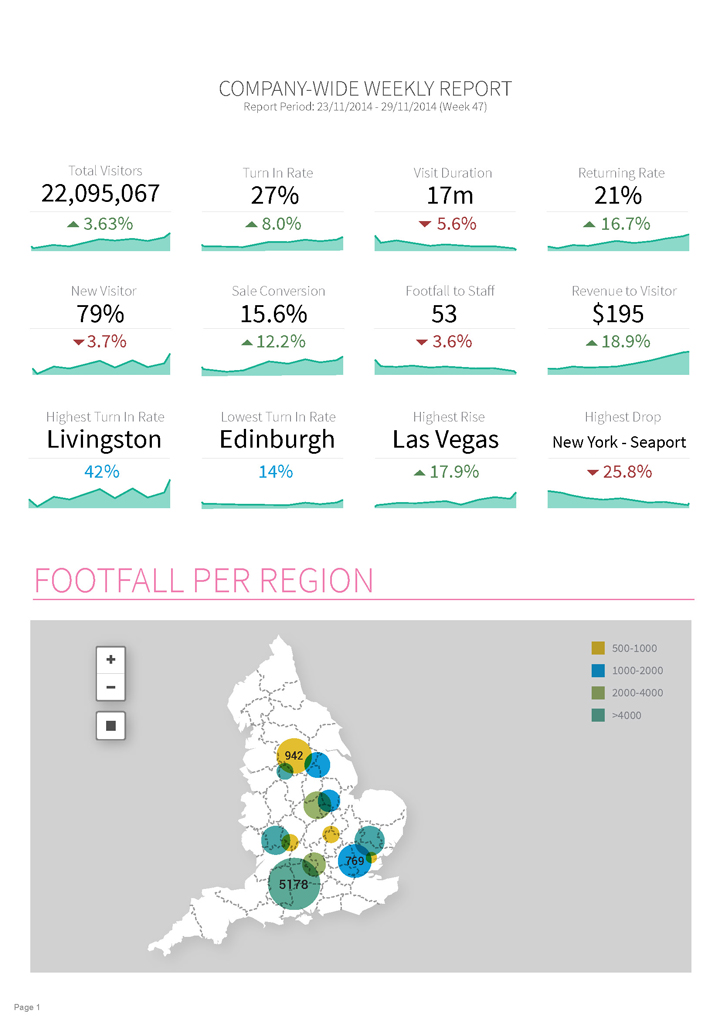
Company Wide Weekly Report
This report is suitable for retail stores as it can display the data for all the branches. You can have the data for all the branches in 1 report so that you can do our analysis more conveniently. Side by side compare can be done, and you can know the performance of different branches through this report.
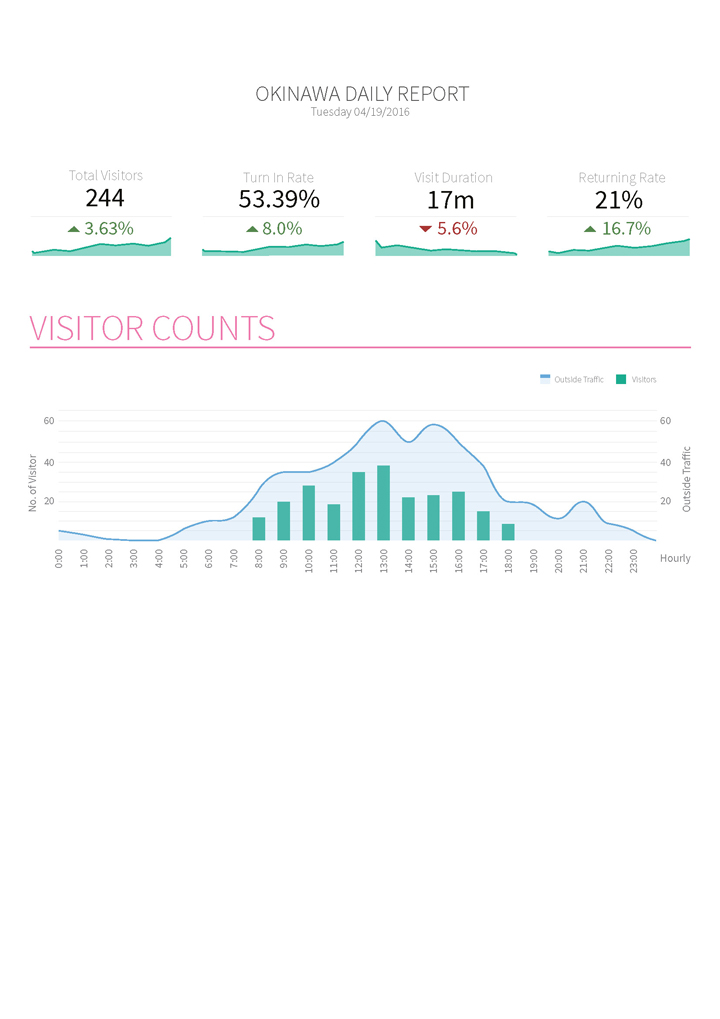
Store Daily Report
If you do not require any complicated report and you would like to only know your store performance, this report can help you to analyse your store daily footfall. This report comprises daily inside and outside traffic of the store, turn in rate and visitor count of the store.
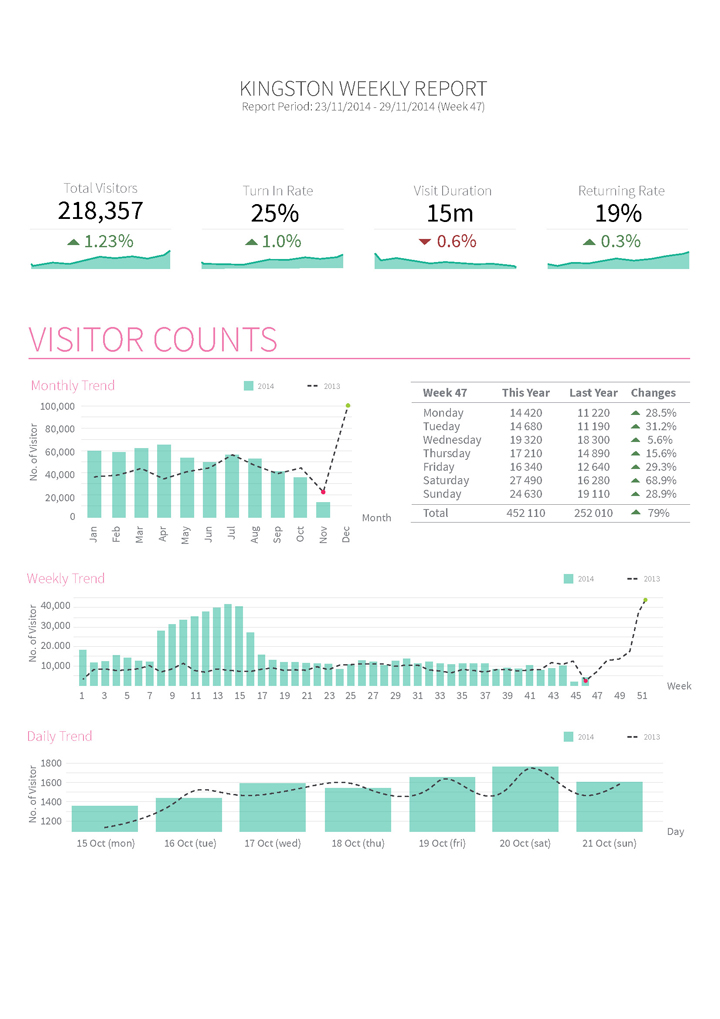
Store Weekly Report
Other than daily report for store’s footfall, you can analyse the store performance through weekly report as well. The user can see the store’s data throughout the week. The weekly report provides a more general and information in a bigger picture.
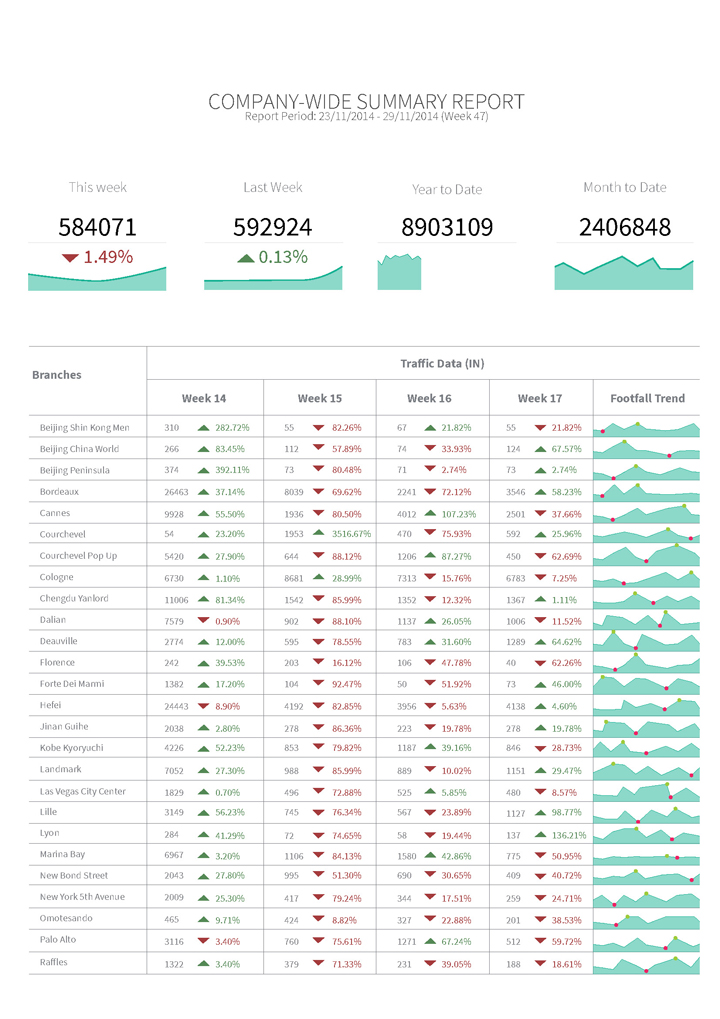
Store Summary Report
This report presents a summary for your store or branches footfall data. This can further be used in wider use such as company management reporting purposes. This report can be integrated with other store’s data such as sales analyse to provide the company management a tool for business decision making process.
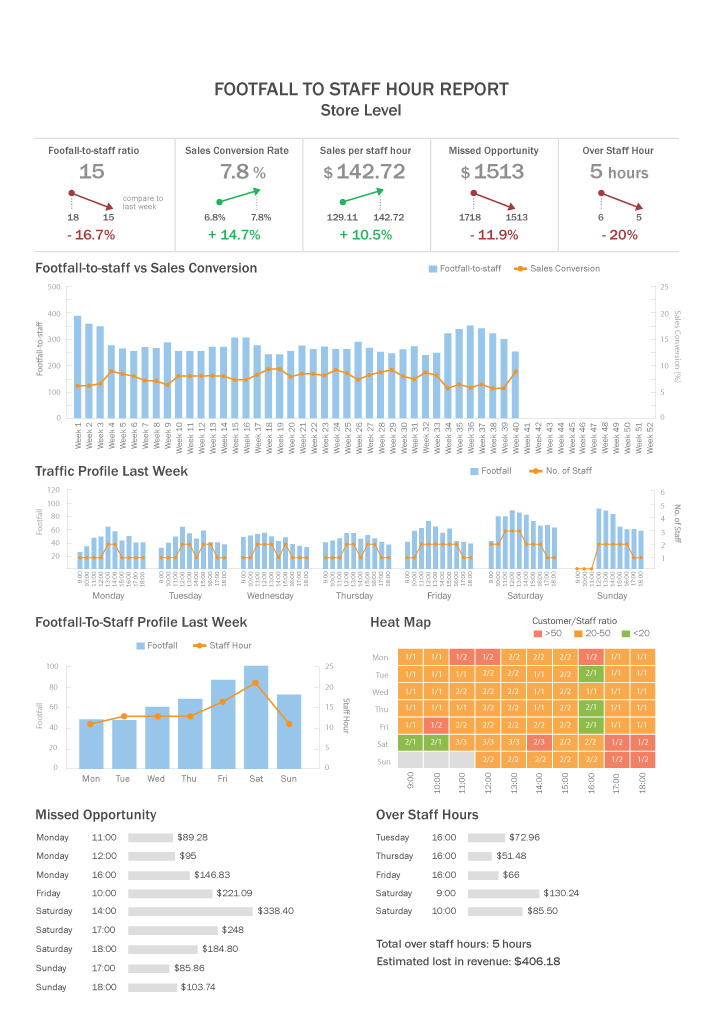
Staff Planning Report
In a business, the most important thing is cost efficiency. To manage the cost in a better way, we have staff planning report for this purpose. This can be used to define the perfect ratio between staffs and the number of visitors. This can help the company to manage the manpower more efficiently and reduce the wastage of manpower.
Key Features
PREDICTIVE ANALYSIS
Combined with Point-of-sales data, weather forecast and based on historical trends, and produced with a predictive analysis, so that operation manager could take action in the staff allocation and achieved the targeted sale revenue.
REAL TIME DATA
Allows users to drill up and down the footfall counting by time of day – hourly, daily, weekly, monthly, yearly – for users to identify the footfall trend, turn in rate, outside traffic, visit duration, returning customer, at regional and store level.

SCHEDULE AUTOMATED REPORTS
Reports can be scheduled to be sent to the key person (e.g store manager for the store weekly reports, marketing manager for the campaign effectiveness reports, etc.) via email on a regular basis.

BOOKMARK REPORTS
You can freely bookmark the reports into your saved list and easily access the reports in daily or weekly basis.

CUSTOMISED REPORTS
Footfallcam portal provide you a complete sets of data and charts, hence, helps you to create your own personalised reports based on what you want to analyse as an additional feature.

REPORTS DRILL DOWN
Footfallcam provide the reports with the drill down attribute for your traffic information from a company-wide level, to regional stats to store level traffic profile.
Related Topics
Downloads
Global Office Network
Copyright © 2002 - 2025 FootfallCam™. All Rights Reserved. Privacy Policy Warranty
Cookies Notification
We use cookies to ensure that we offer you the best experience on our website. By continuing to use this website, you consent to the use of cookies.
Select Your Language
Please select your prefer language.

