


5 × Metrics in One Device
Combining 2 Technologies - Video Counting + Wi-Fi Counting
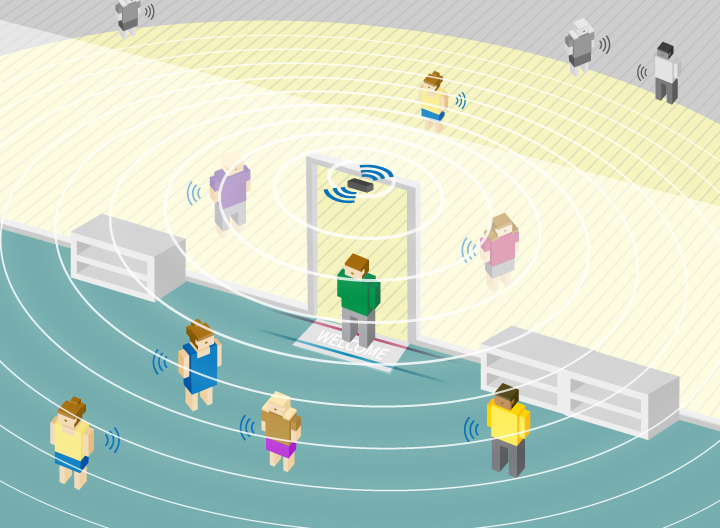
We are the first in the world to combine video analytics counting and Wi-Fi beacon tracking in one device, giving you 5 business metrics:
Video Counting

Wi-Fi Tracking
1) Footfall Counting
2) Outside Traffic
3) Dwell Time
4) Returning Customers
5) Cross Shopping
Video Counting Combine with Wi-Fi Counting
Video counting technology is used to count the total number of people that enter and exit the site. Meanwhile, Wi-Fi technology enables the counter to capture the unique MAC address from smart devices people carry and provide further analysis, such as zone analytics, dwell time, passer-by count, turn-in rate, traffic flow, returning customer rate and cross shopping.

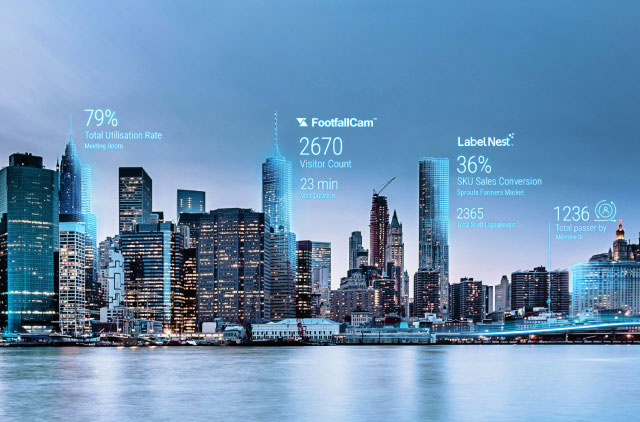
Visitor Count

Visit Duration

Cross Shopping

Outside Traffic

Returning Customer
Metric 1: Visitor Count
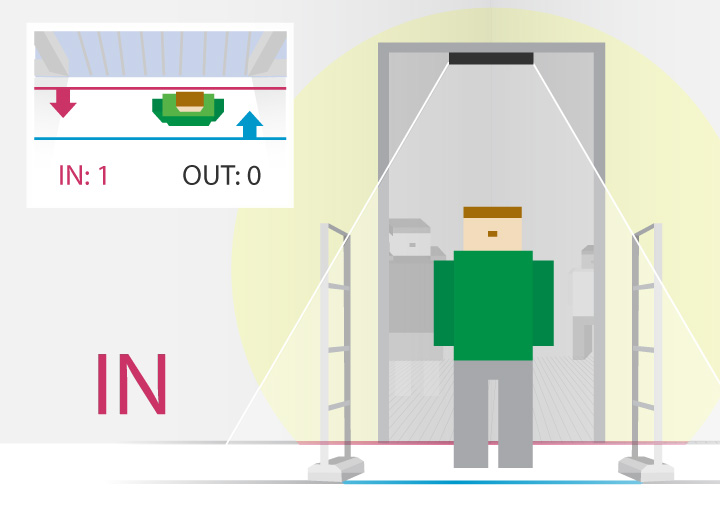
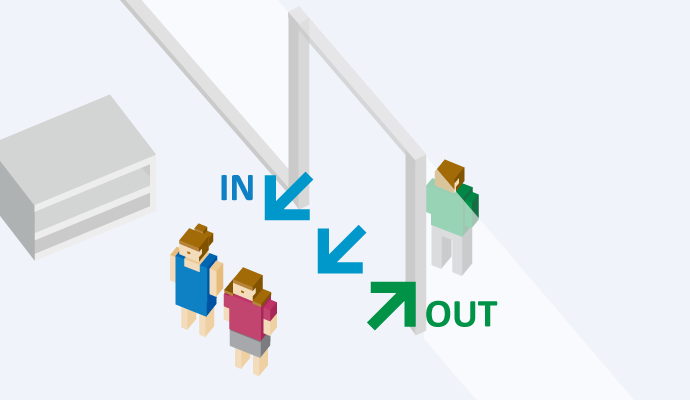
FootfallCam's people counter can help to find out the number of people that enter to your store. It conducts bidirectional counting, which allows it to count in and out simultaneously. FootfallCam achieves a high counting accuracy of 95% and above by employing the most advanced algorithm, based on both color and texture mapping, identifying and solving any issues with shadows and light level changes.
Metric 2: Street Counting
Using video tracking technology to identify the number of shopper passed by the store. Able to identify the absolute number of the people passed by the store front. It gives retailers to understand the window display effectiveness and overview on the miss-opportunity of the branch.
Metric 3: Visit Duration
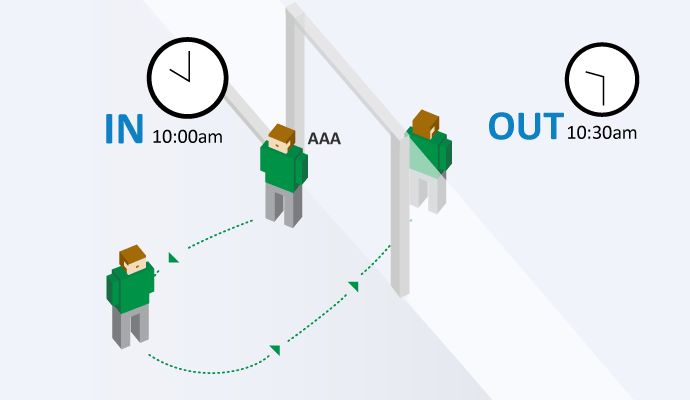
Visit duration is measured based on unique identifier (MAC ID probes) from user’s smartphone. It could approximate the time of a visitor entered and left the store. You can know how long your customer stay in your store. And also, by looking at the dwell time and sales transaction, management will be able to find the pattern matching.
Metric 4: Outside Traffic
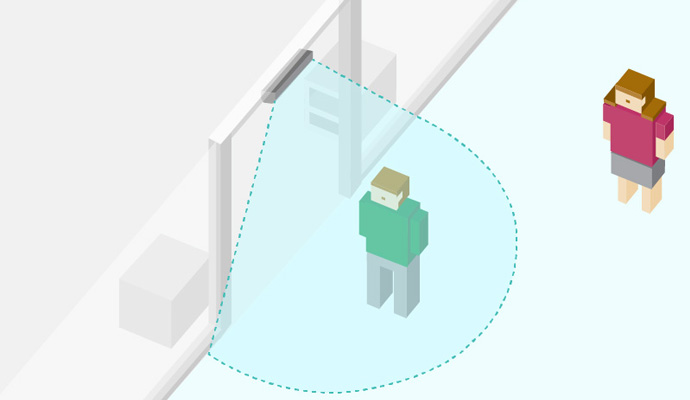
FootfallCam can detect user's position within 100m radius. Based on the signal strength, it detects passer by outside the store and gives you the storefront conversion rate by comparing with the store footfall. We will have answer for queries such as how many missed opportunity outside the operating hours and how many people passing through has actually visited the store.
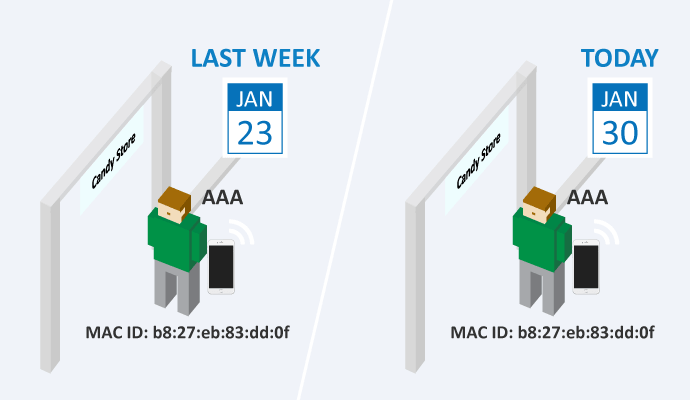
Metric 5: Returning Customer
Distinguishes if the customer has visited the store before by comparing the unique identifies with previous records. You are able to find out how many customers have returned in last 3 months. This can be used to measure customer loyalty via the frequency and shopping habits of returning customers.
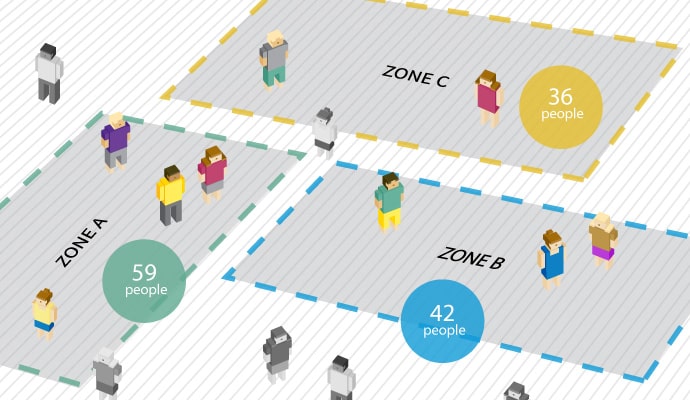
Metric 6: Zone Analytics
Location analytics uses advanced data mining techniques tuned to the type of data Wi-Fi location provides. Location analytics provides two methods for defining the different zone or area of a venue. Explicit zones can be defined by the user as named polygons that represent known defined spaces. It could be identifiable by its Zone ID.
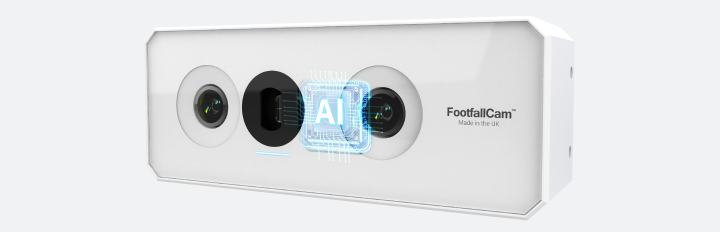
3D Stereo Vision Technology
3D Stereoscopic is using 2 lens to facilitate depth perception and 3D-reconstruction in an image.
Information capture from the two differing views will be combined and interpreted into depth data, which are inversely proportional to the differences in distance to the objects.
Depth information allows camera to distinguish a group of people as separate objects, such as one person in front of another.
It can count accurately even when more than 10 people come in and out of the store at the same time.
Benefits:

U-turn Traffic Flow Not Counted
Utilising the advanced video counting algorithm, FootfallCam people counter continuously track the traffic flow and excluded u-turn from the counting.
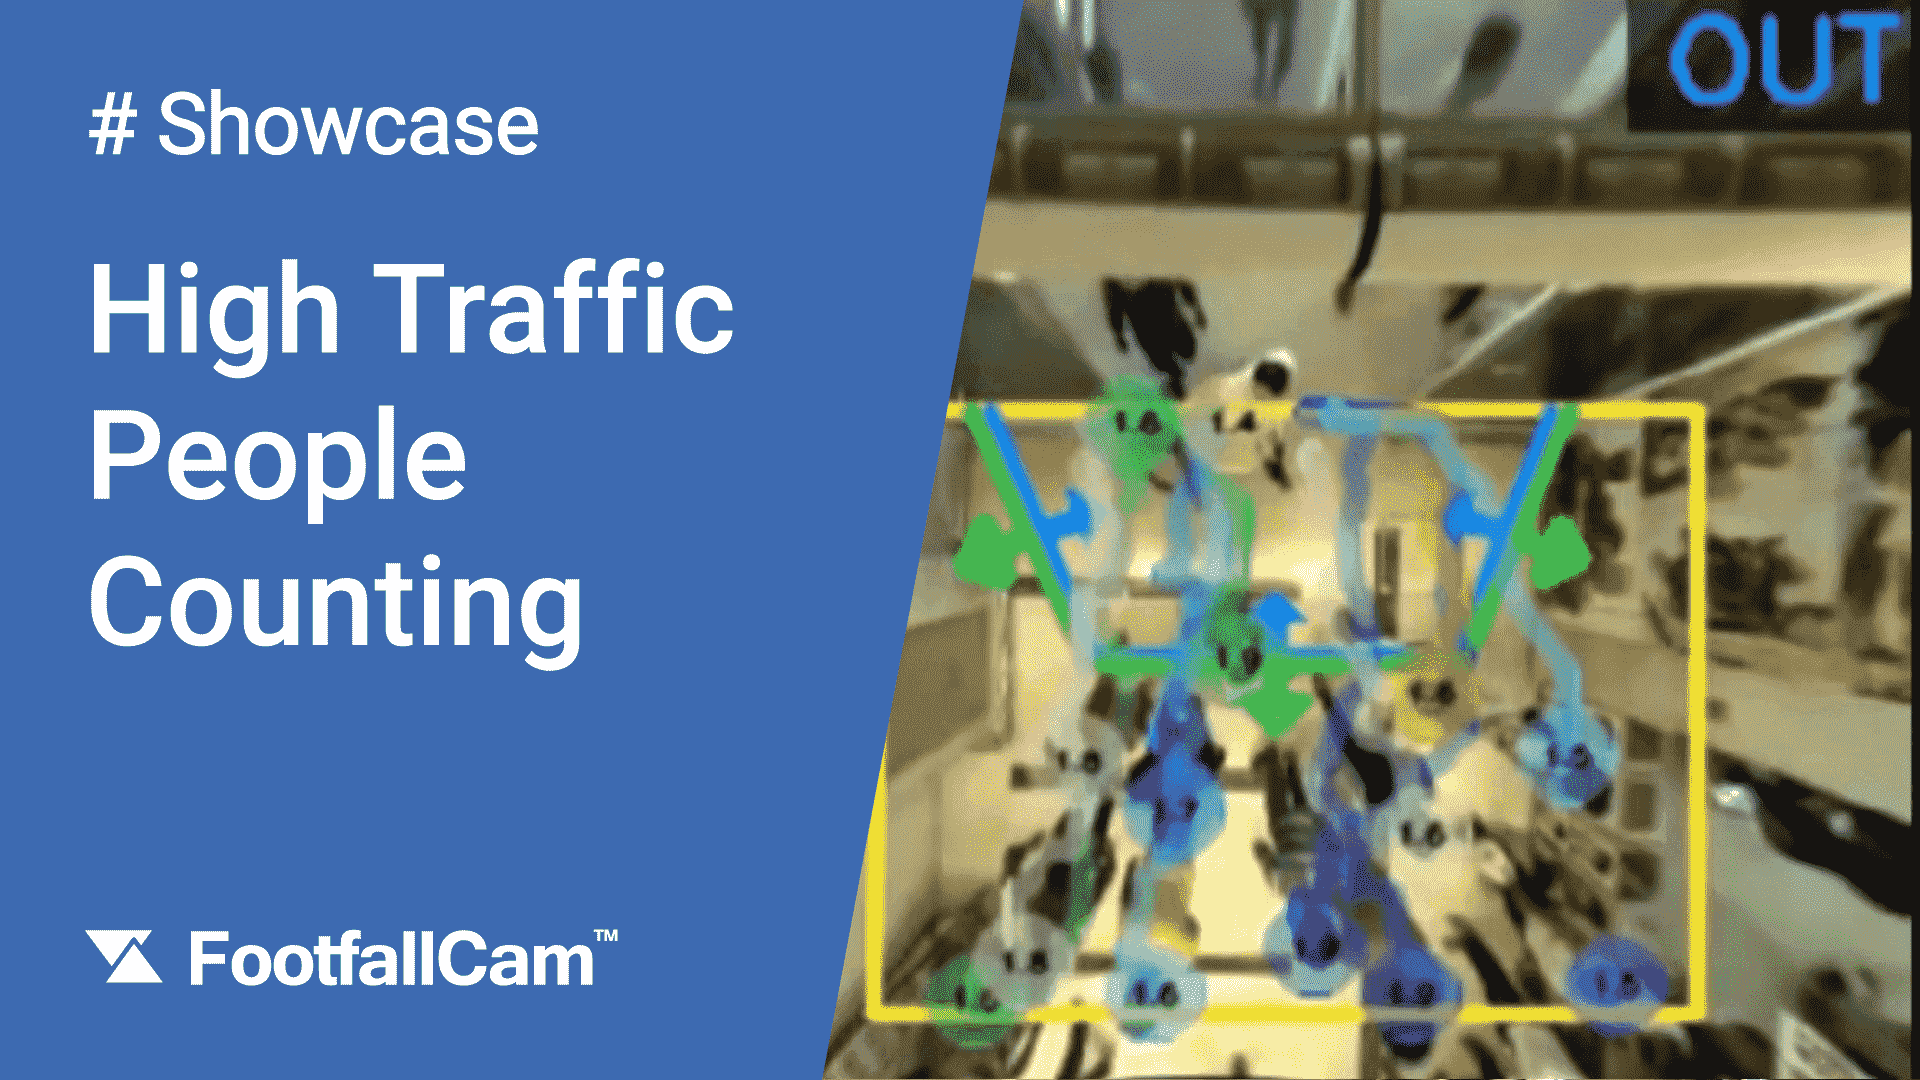
Accurate Counting in High Traffic
Depth information allows counter to distinguish a group of people as separate objects, such as one person in front of another.
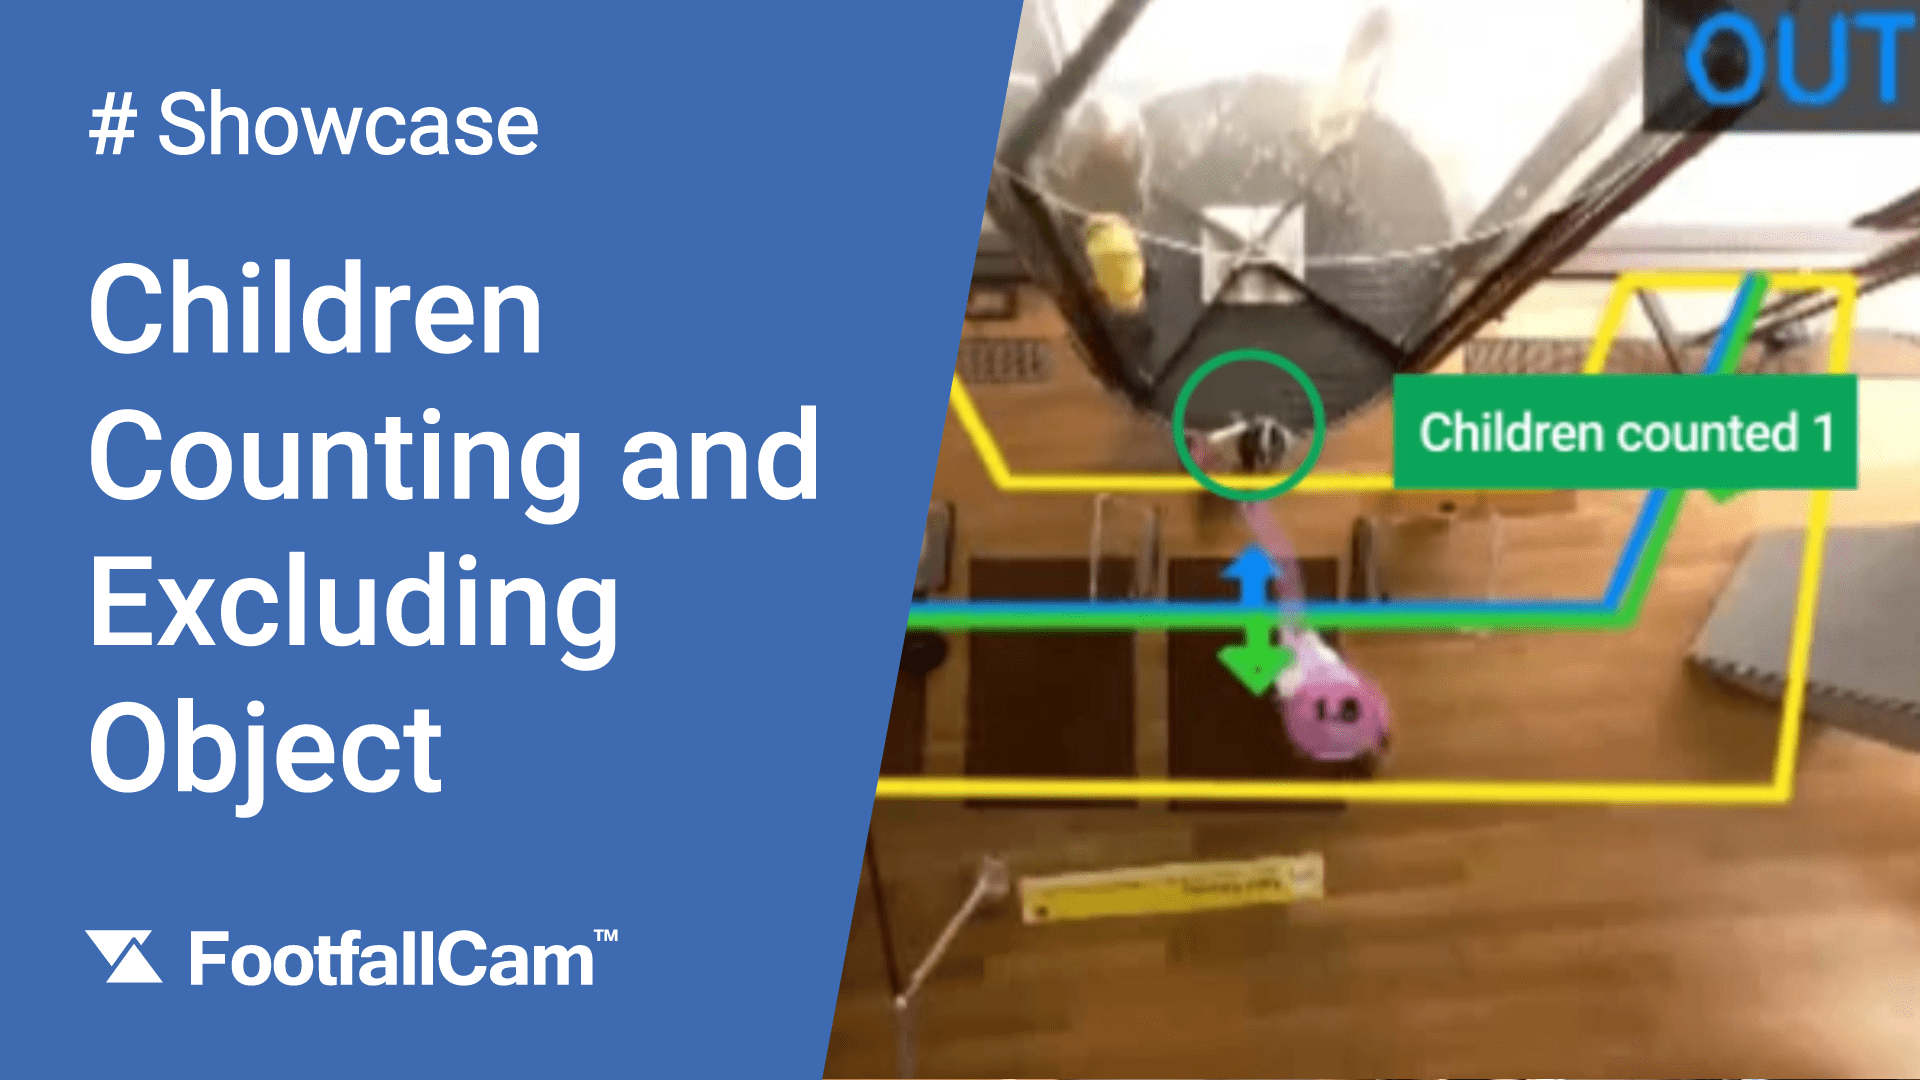
Differentiate Between Trolley and Children
Based on the shape and size of the polygon tracked, FootfallCam counter intelligently discounted non-human object such as trolley, baby pushchair, etc.
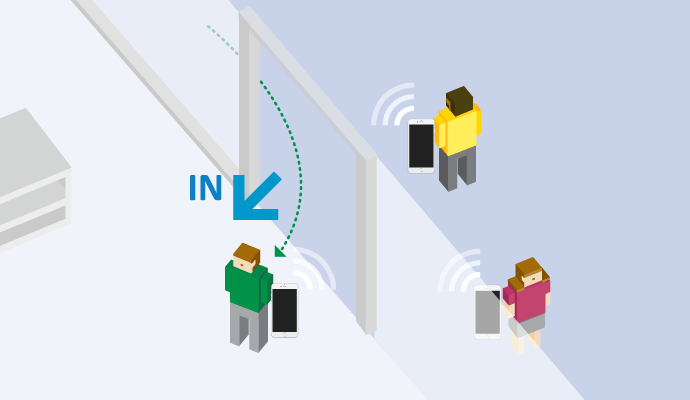
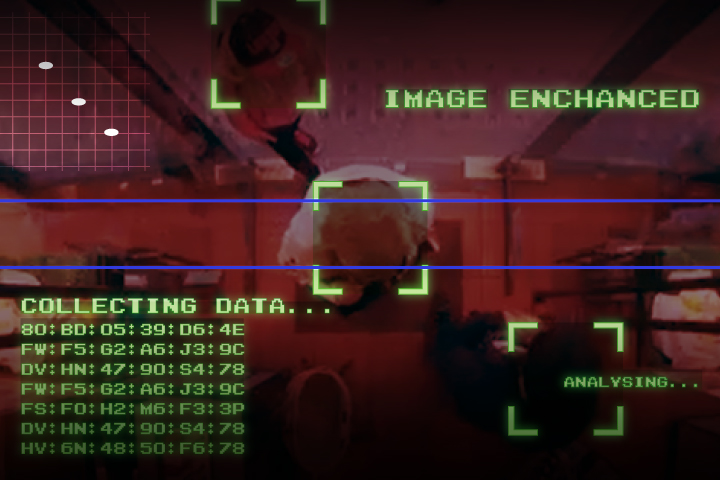
How Does Wi-Fi Counting Work?
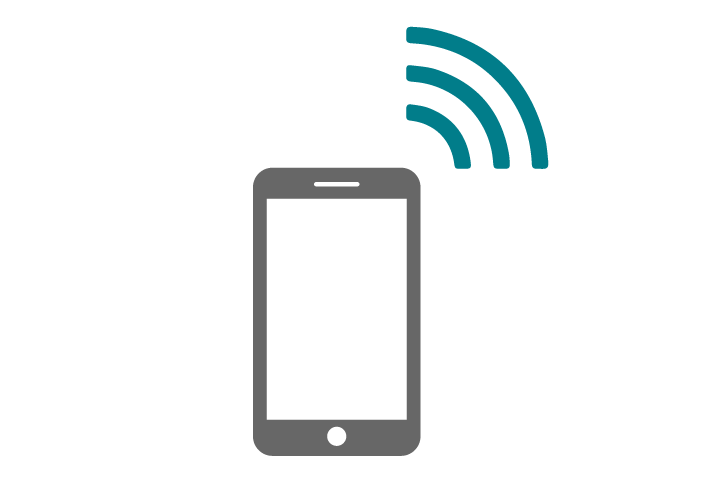
Each phone would transmit a Wi-Fi beacon signal every 2 - 8 seconds
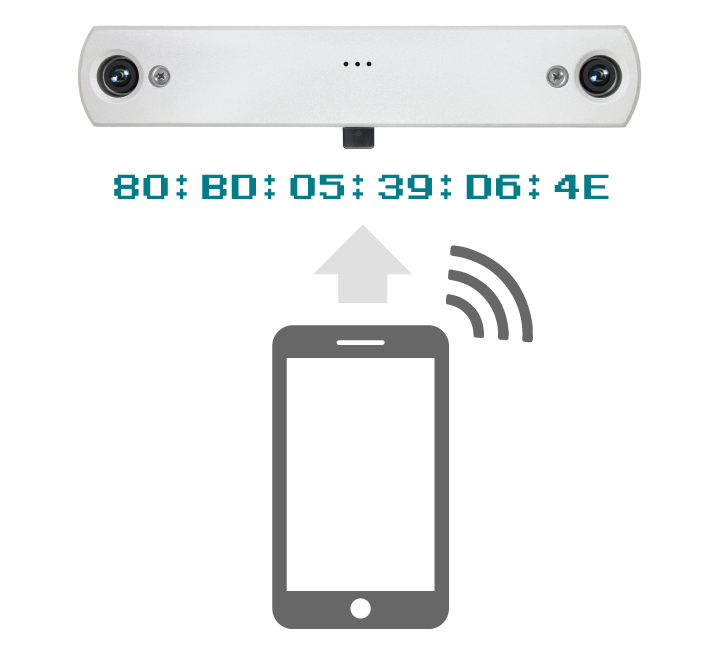
Each Wi-Fi beacon carries a MAC address which is unique to each phone
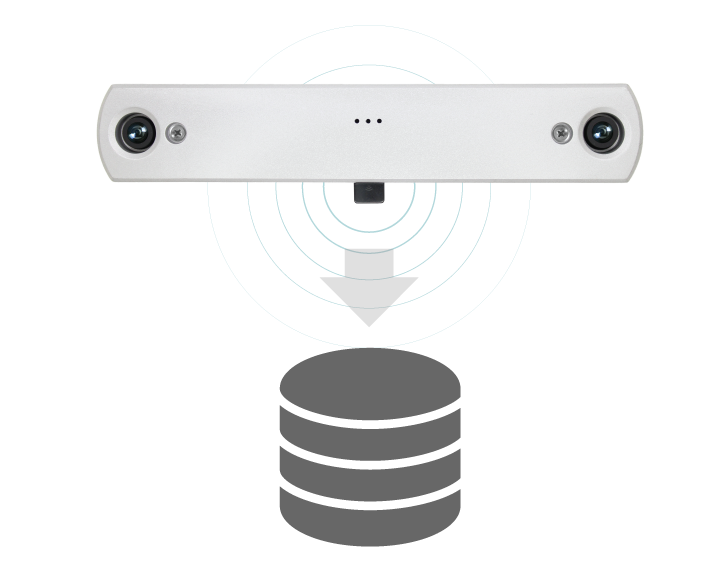
By listening to the MAC address, the counter can identify each unique visitor
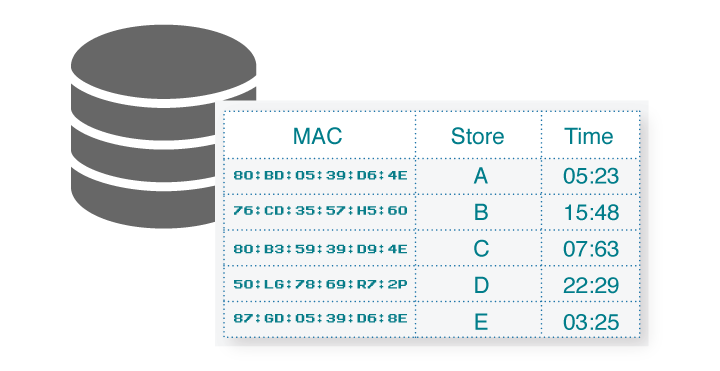
The signal strength of probes can give the approximate location of each person
Auto Tuning Technology
Auto Tuning Technology
Each shop floor environment is different, however our Wi-Fi tracking can learn the behavior of the walking path based on a large quantity of sample size and auto adjust the setting to suit the unique shop environment. Auto tuning technology is the key development in people counting to ensure all counters across all location are providing more accurate data. This auto-tuning methodology makes sure our counters to maintain 98% accuracy during data collection.

Counting Line

Ceiling Height

Floor Space

3D Imaging
Heat Map / Path Map
Heat Map / Path Map
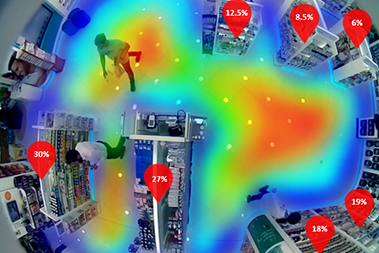
Heat maps video analytics help increase area conversions by providing fact-based insights that answer key questions and enable retailers to improve product display, store marketing, merchandising and operations, as well as the shopper experience. With the help of heatmap analysis, retailer can easily identify the hot and cold area of the store. It also provide the measurement like:
- Passer by- how many is only pass by the area with a few second without stopping and look at the item
- Engaged customer- how many has been stopped and dwell in the specific area exceed the certain time threshold
- Area Conversion- percentage of the engaged customer in the interested area of measurement
- Area Dwell Time- time spent of the shopper in the specific area
Demographics Analysis on gender, age group, mood and interest area
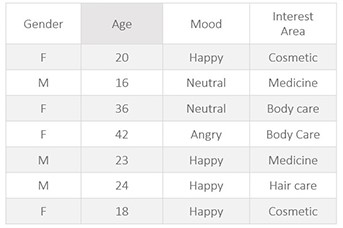
With the intelligent video analytics technology, the people counter can combined the feature to allow more in-depth analysis on the customer profiling like gender, age group and mood. With the implementation on the in-store people counter which serve as the heatmap feature inside the store with full section coverage, it can accurately measure the interest area where the most people will be attending.
Demographics Analysis on gender, age group, mood and interest area
With the intelligent video analytics technology, the people counter can combined the feature to allow more in-depth analysis on the customer profiling like gender, age group and mood. With the implementation on the in-store people counter which serve as the heatmap feature inside the store with full section coverage, it can accurately measure the interest area where the most people will be attending.
Related Topics

How to Buy
Footfallcam work with a global network of reseller to offer local service to our customer