Chapter 4: Business Functions
This chapter will mainly describe about the dashboards and reports.
The differences between dashboards and reports are as below:
- Dashboards: interactive but cannot be scheduled to send
- Report: non-interactive but can be scheduled to send
4.1 Data Visualisation
4.1.1 Dashboard Catalogue
Below showed the full list of dashboard templates available, dashboard availability may vary depending on the company subscription plan, individual user account and their corresponding user group permissions.
| Dashboard Name | Purpose | Audience |
|---|---|---|
| Footfall Overview Dashboard | To have an overview of the footfall trend (visitor count) across all sites | Store Manager |
| Live Occupancy Dashboard (Public View) | To review current occupancy of the site and whether it exceed the capacity | Visitor and store manager |
| Live Occupancy Dashboard (Staff View) | To review today's occupancy from start of operation until now | Store Manager |
| Store Performance Dashboard (Footfall and Demographics) | To review the store performance, including footfall, busiest hours, and demographics. | Store Manager |
| Store Performance Dashboard (Footfall and In-store Analytics) | To review the store performance, including footfall, busiest hours, and engagement rate. Allow managers to set strategies to achieve targeted KPI. | Store Manager |
| Store Performance Dashboard (Footfall and Sales) | To review the store performance, including footfall, busiest hours, and sales conversions. | Store Manager |
| Store Performance Dashboard (Footfall) | To review the store performance and set strategy in order to achieve targeted KPI | Store Manager |
| Store League Table | To compare performance across different sites, facilitating strategic decision-making to optimize operations and drive profitability | Store Manager |
| Building Performance Dashboard | To review the shopping mall performance and arrange facilities accordingly | Mall Manager |
| Customer Engagement Dashboard | To identify engagement of each zone, allowing strategic product placement to enhance customer interaction and sales | Store Manager |
| Visitor Count and Occupancy Dashboard | To have a comprehensive view of visitor dynamics and space utilisation for resources allocation | Store Manager |
| Queue Performance Dashboard | To have overview of queue wait time and arrange resources accordingly | Store Manager |
| Live Occupancy Floorplan Dashboard | To identify which zone has high or low engagements based on the duration visitors stay within the zone, allowing strategic product placement for enhancing customer interaction and sales | Store Manager |
| Session-based Footfall Analytics Dashboard | To analyse visitor trends, optimise space utilisation, enhance management, and make data-driven decisions for improved operational efficiency and visitor satisfaction | Store Manager |
| Zone Footfall Analytics Dashboard | To explore daily and hourly trends in zone-specific footfall and visit duration within the selected site | Store Manager |
| Airport Live Queue Monitoring Dashboard | To have an overview of the queue waiting time at the airport. Allows managers to enhance services based on the live data. Managers will be notified when the queue time exceeds the preset benchmark | Airport Manager |
| Airport Live Passenger Flow Dashboard | To have an overview of the passenger flow at the airport. This includes the average waiting time and number of queuing passengers in each area. | Airport Manager |
| Real Time Entrance Traffic Monitoring Dashboard | To have an overview of the real time traffic by comparing the current occupancy with the capacity. Managers will be notified if the current occupancy has breached the capacity. Suitable for indoor events. | Event Manager |
4.1.2 Report Catalogue
Below showed the full list of report templates available, report availability may vary depending on the company subscription plan, individual user account and their corresponding user group permissions.
| Level of Reporting | Report Name | Industry | Usage |
|---|---|---|---|
| Regional Level | Regional Footfall Report (Daily) | Retail Store | To showcase the daily trend across all branches based on a compiled daily report for macro view across all stores in the chain and drill down to an individual store in question if performance drops. |
| Regional Level | Regional Footfall Report (Weekly) | Retail Store | To showcase the overall weekly trend across all branches within the company and provide all C-level executives with a comprehensive insight on the consumer behaviors and have a macro view of the performance of the stores. |
| Regional Level | Regional Footfall Report (Monthly) | Retail Store | To showcase the overall trend across the previous month for all branches within the company. Provide all C-level executives with a comprehensive insight on the consumer behaviors and have a macro view of the performance of the stores. |
| Regional Level | Regional Sales Report (Daily) | Retail Store | To showcase the daily sales trend across all branches based on a compiled daily report for macro view across all stores in the chain. Able to compare performance of each store and allocate resources accordingly. |
| Regional Level | Regional Sales Report (Weekly) | Retail Store | To showcase the overall weekly sales trend across all branches within the company and provide all C-level executives with a comprehensive insight on the consumer spending behaviors and have a macro view of the performance of the stores. |
| Regional Level | Regional Sales Report (Monthly) | Retail Store | To showcase the overall sales trend across the previous month for all branches within the company. Provide all C-level executives with a comprehensive insight on the consumer spending behaviors and have a macro view of the performance of the stores. |
| Site Level | Store Footfall Report (Daily) | Retail Store | To showcase the daily trend across the site and have a macro view of the performance of the site. |
| Site Level | Store Footfall Report (Weekly) | Retail Store | To showcase the overall trend across the week and provide a comprehensive insight on the consumer behaviors and have a macro view of the performance of the site. |
| Site Level | Store Footfall Report (Monthly) | Retail Store | To showcase the overall trend across the previous month and provide a comprehensive insight on the consumer behaviors and have a macro view of the performance of the site. |
| Site Level | Store Sales Report (Daily) | Retail Store | To showcase the daily sales trend across the site and have a macro view of the performance of the site. |
| Site Level | Store Sales Report (Weekly) | Retail Store | To showcase the overall sales trend across the week and provide a comprehensive insight on the consumer spending behaviors and have a macro view of the performance of the site. |
| Site Level | Store Sales Report (Monthly) | Retail Store | To showcase the overall sales trend across the previous month and provide a comprehensive insight on the consumer spending behaviors and have a macro view of the performance of the site. |
| Site Level | Mall Footfall Report (Daily) | Shopping Mall | A daily run through of the performance of the shopping mall in comparison of the previous day. Management can implement better personnel allocation based on the peak traffic in area. |
| Site Level | Mall Footfall Report (Weekly) | Shopping Mall | To showcase the overall trend across the week and provide a comprehensive insight on the consumer behaviors of the shopping mall. |
| Site Level | Mall Footfall Report (Monthly) | Shopping Mall | With monthly insight into the shopping mall performance, overseers and developers will have analytical insight into the total visitor count of their mall and to quantify customer loyalty in certain areas or zones. |
| Area Level | Area Footfall Report (Daily) | Retail Store/Shopping Mall | A daily run through of the performance of the store or shopping mall focusing on different areas. The area type includes Floor Level/Zone/Mall or Store Entrance. Management can implement better personnel allocation based on the peak traffic in the area. |
| Area Level | Area Footfall Report (Weekly) | Retail Store/Shopping Mall | To showcase the overall trend across the week and provide a comprehensive insight into consumer behaviors focusing on different areas. The area type includes Floor Level/Zone/Mall or Store Entrance. Management can implement better personnel allocation based on the peak traffic in the area. |
| Area Level | Area Footfall Report (Monthly) | Retail Store/Shopping Mall | With monthly insight into the store or shopping mall performance, overseers and developers will have analytical insight into the total visitor count in each area and quantify customer loyalty in certain areas or zones. |
4.1.3 Analytics Widget
Analytics widget is designed to enable data analysts to easily access for data comparison, across different granularity, metrics, and period. Multiple workspaces and datasets are provided for various use cases.
Dataset
Dataset is a set of data with specific granularity and metrics, designated to be used in analytics. For more information you may refer here.
Analytics Widget
| Widget Name | Description |
|---|---|
| Hourly Data Analytics | To compare desired entity across the same metric at the same period by hour. |
| Time Series Comparison | To compare the same metric across different time periods |
| Entity Comparison | To compare the different entities (e.g. Site A compare Site B, or Area A compare Area B) across the same metric and same period. |
| Metric Comparison | To compare different metrics across same time period and same entity |
| Before and After Event Comparison | To compare the metrics before the event, during the event and after the event. |
| Pivot Table | To compare data across entities, metrics and time intervals by customising the row, column and series. |
| Heatmap Table | To analyse the metric by comparing time vs time or time vs entity. |
| Trend Analytics | To analyse the trend of selected entity and metric over specific periods making it easier to observe seasonality pattern. |
4.2 Rules Engine
4.2.1 Rule Settings
4.2.1.1 How to create a new rule?
Step 1 - Go to Settings > Rule Settings > click on + New Rules button.
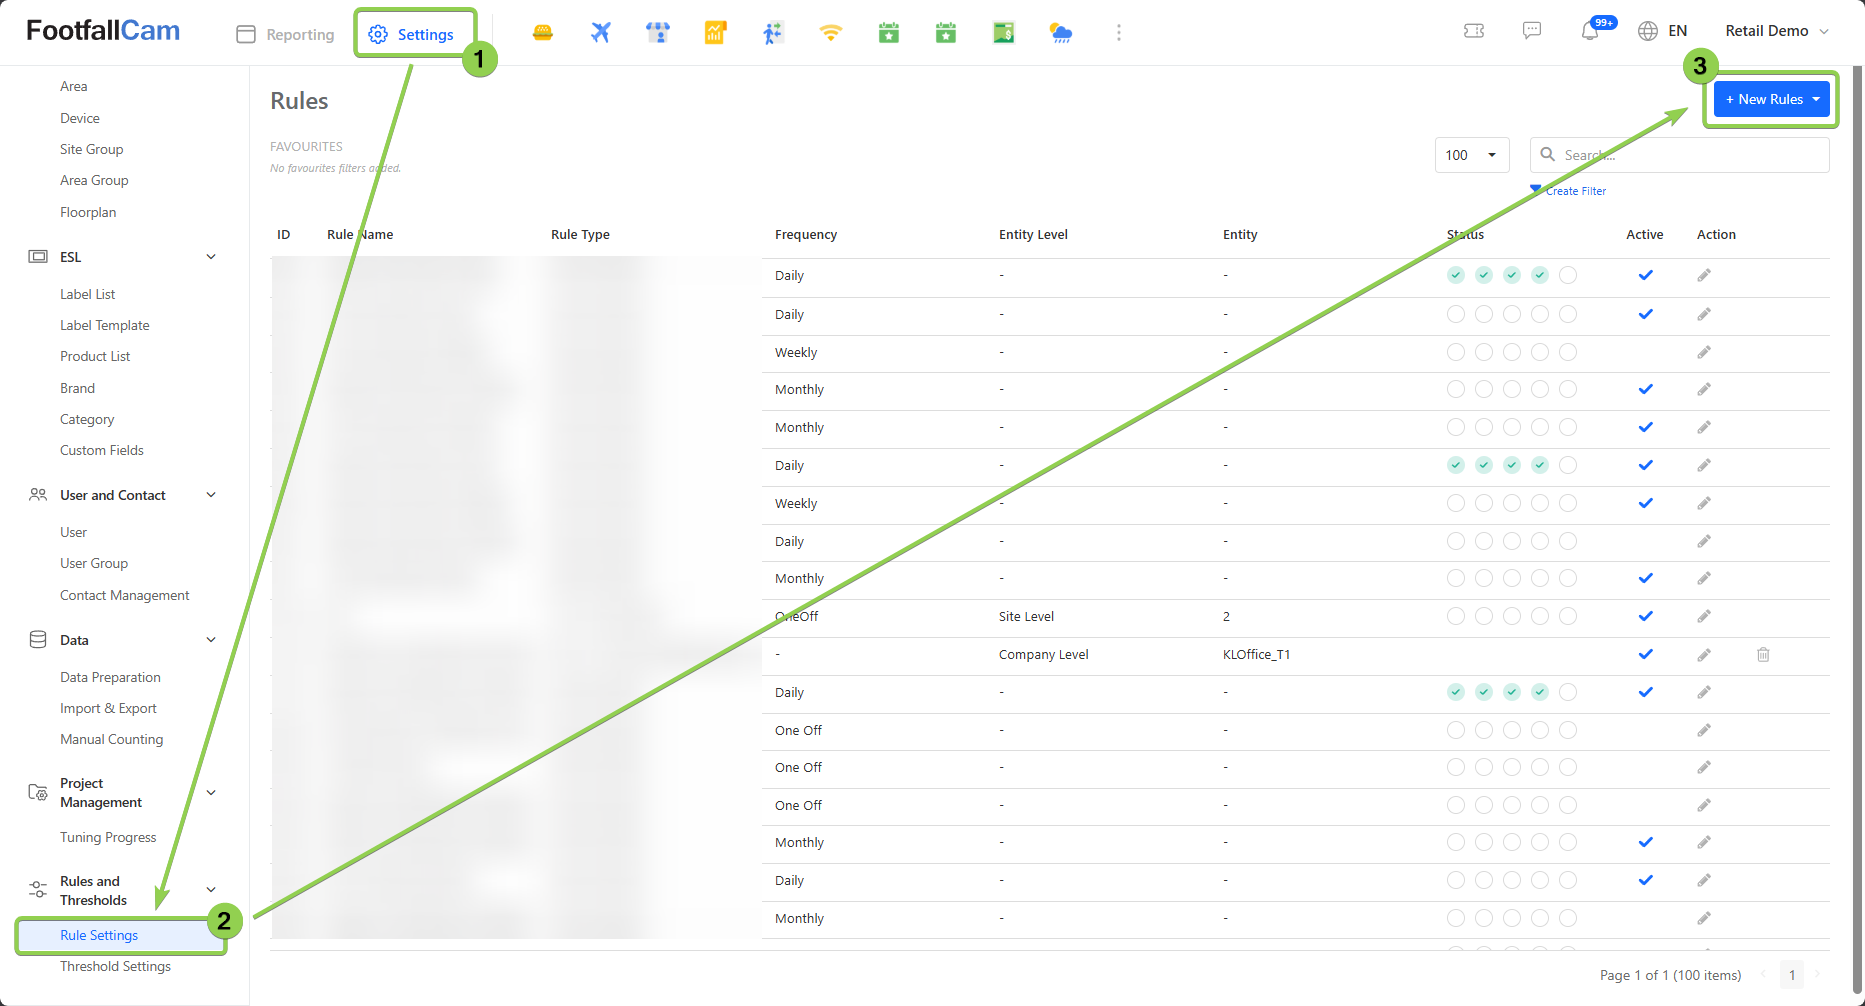
Step 2 - After click on the + New Rules button, it will show a drop-down list.

| Options | Description |
|---|---|
| 1. Create from Rule Template | To create new rule, please refer to this link about the details information about the Rule Type. |
| 2. Data Import | To create new Import Job, please refer to this link |
| 3. Data Export | To create new Export Job, please refer to this link |
| 4. Email Scheduler | To create new Email Scheduler, please refer to this link |
| 5. Bulk Email Scheduling | To create a bulk schedule Job, please refer to this link |
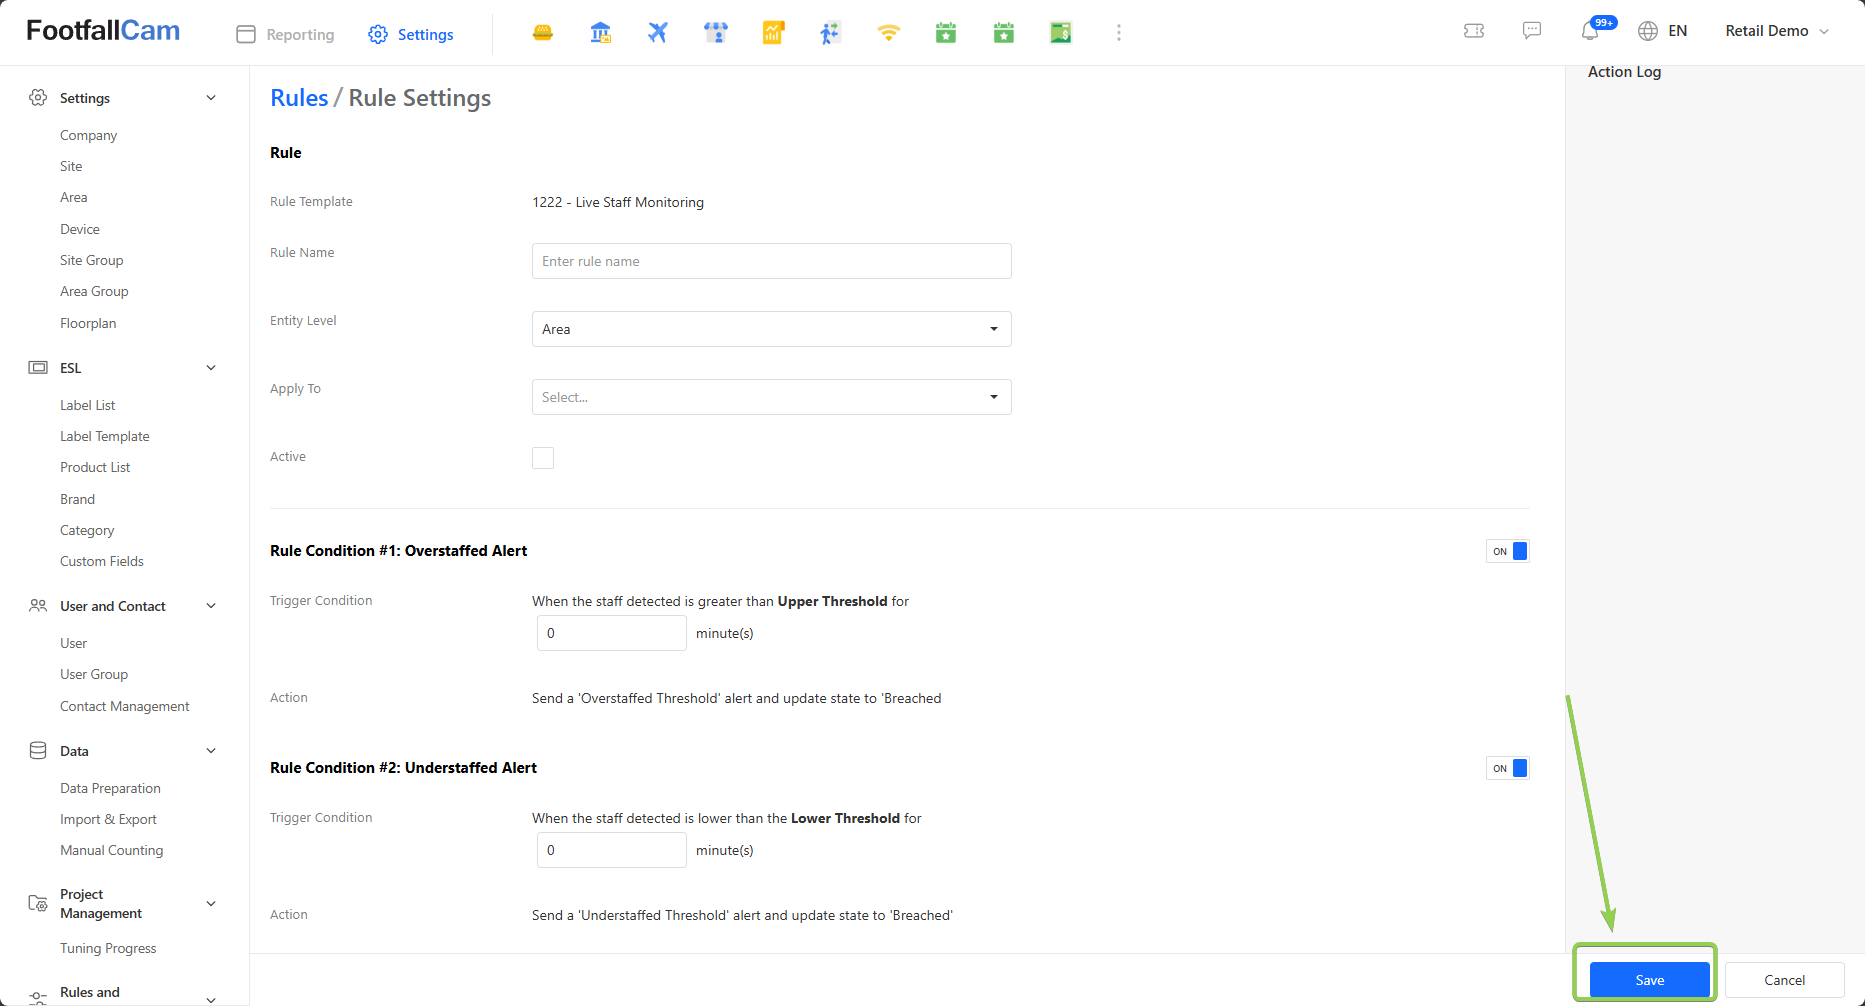
Step 3 - Please select "Create from Rule Template" to create the rule and click on "Create" button after select the expected rule type.

Step 4 - It will bring you to the related settings page, please fill in all the information and click on "Save"
4.2.1.2 How to edit the rule?
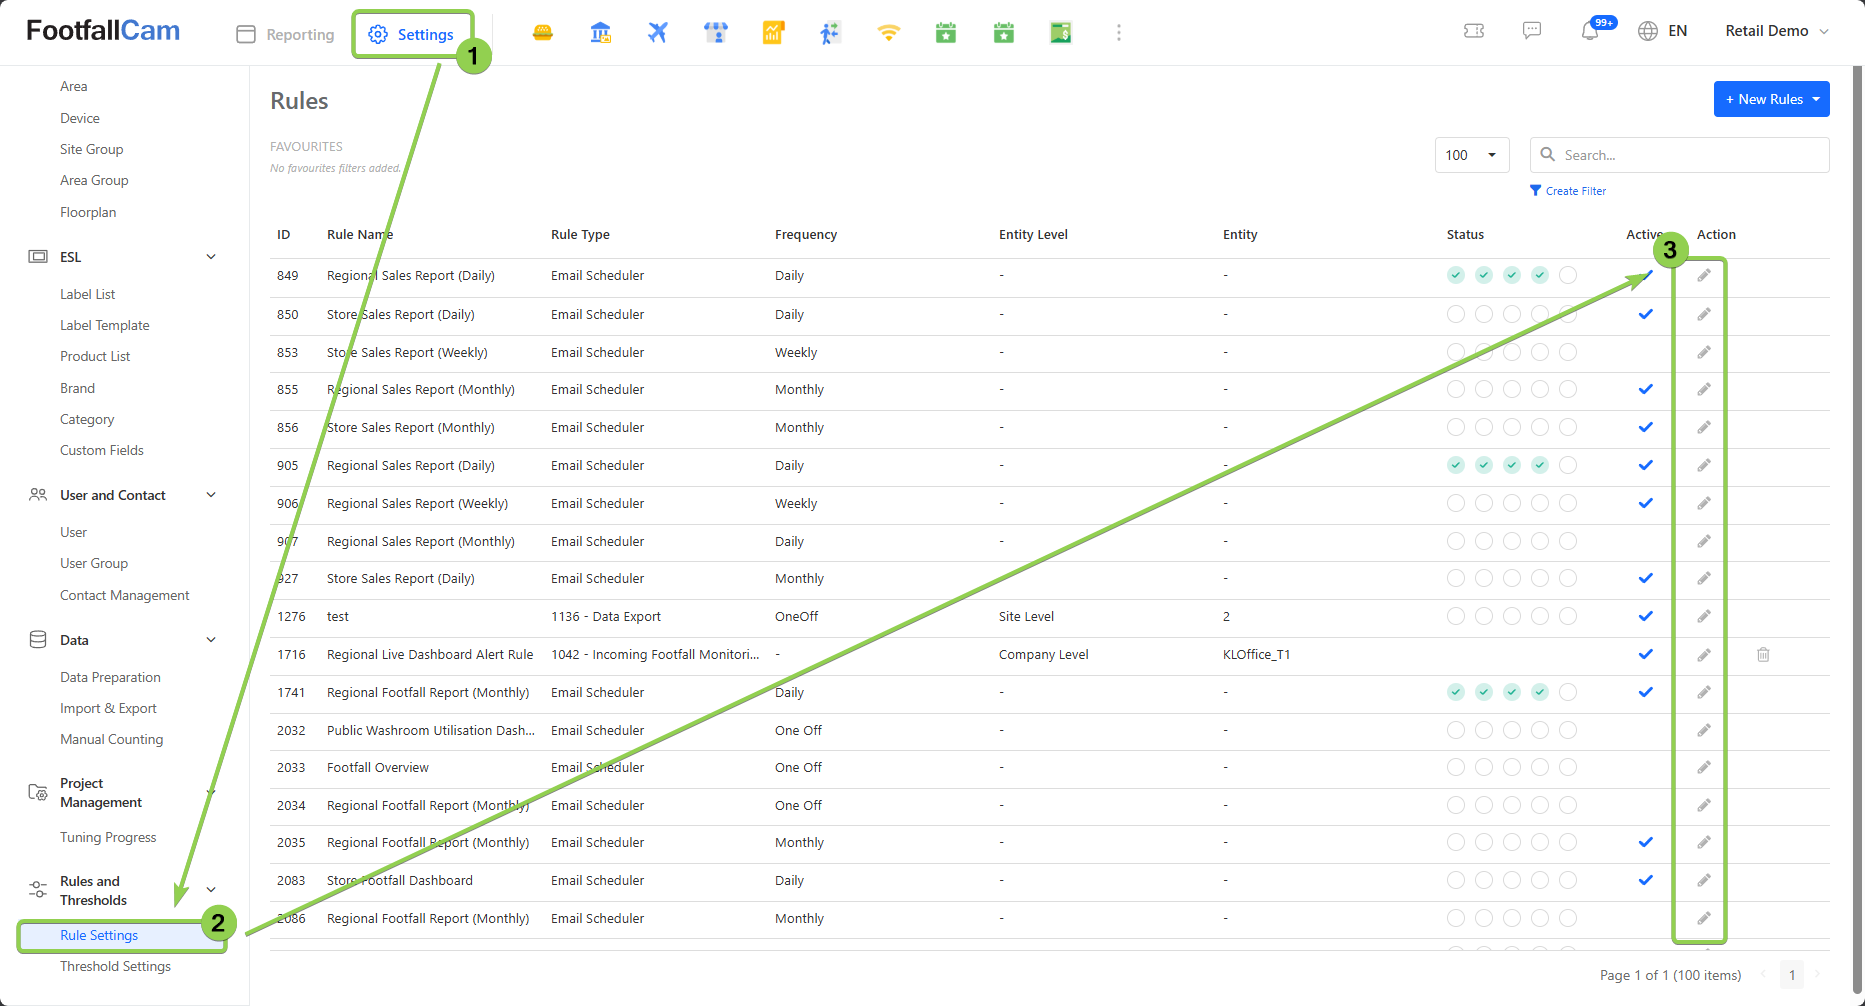
Step 1 - Go to Settings > Rule Settings to view the existing rule list, click on the pen icon to edit the rule.
Step 2 - Next, it will bring you to the related setting page. Please do the update in that settings page and click on Save button to save the changes.
4.2.2 Threshold Settings
4.2.2.1 How to Create New Threshold
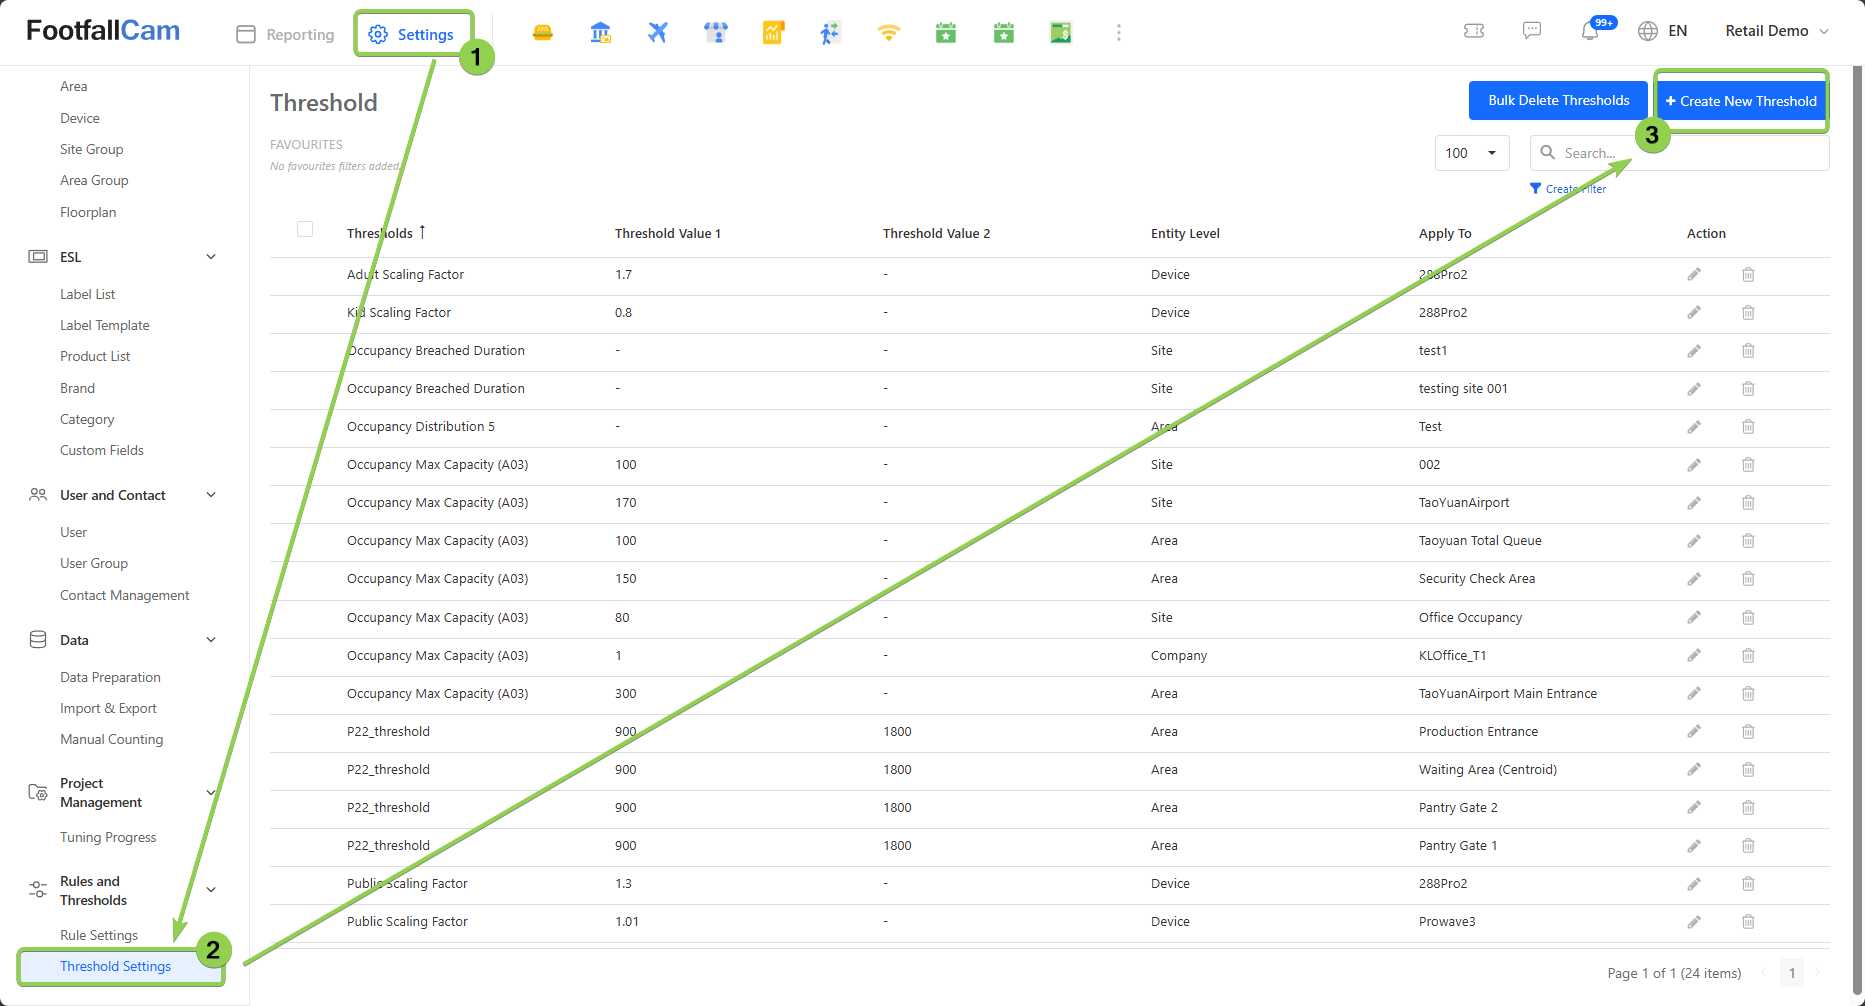
Step 1 - Click on Settings > Threshold Settings > Create New Threshold button to access the Threshold Settings page.
Step 2 - Fill in the relevant information for the required fields and click on the Create button.
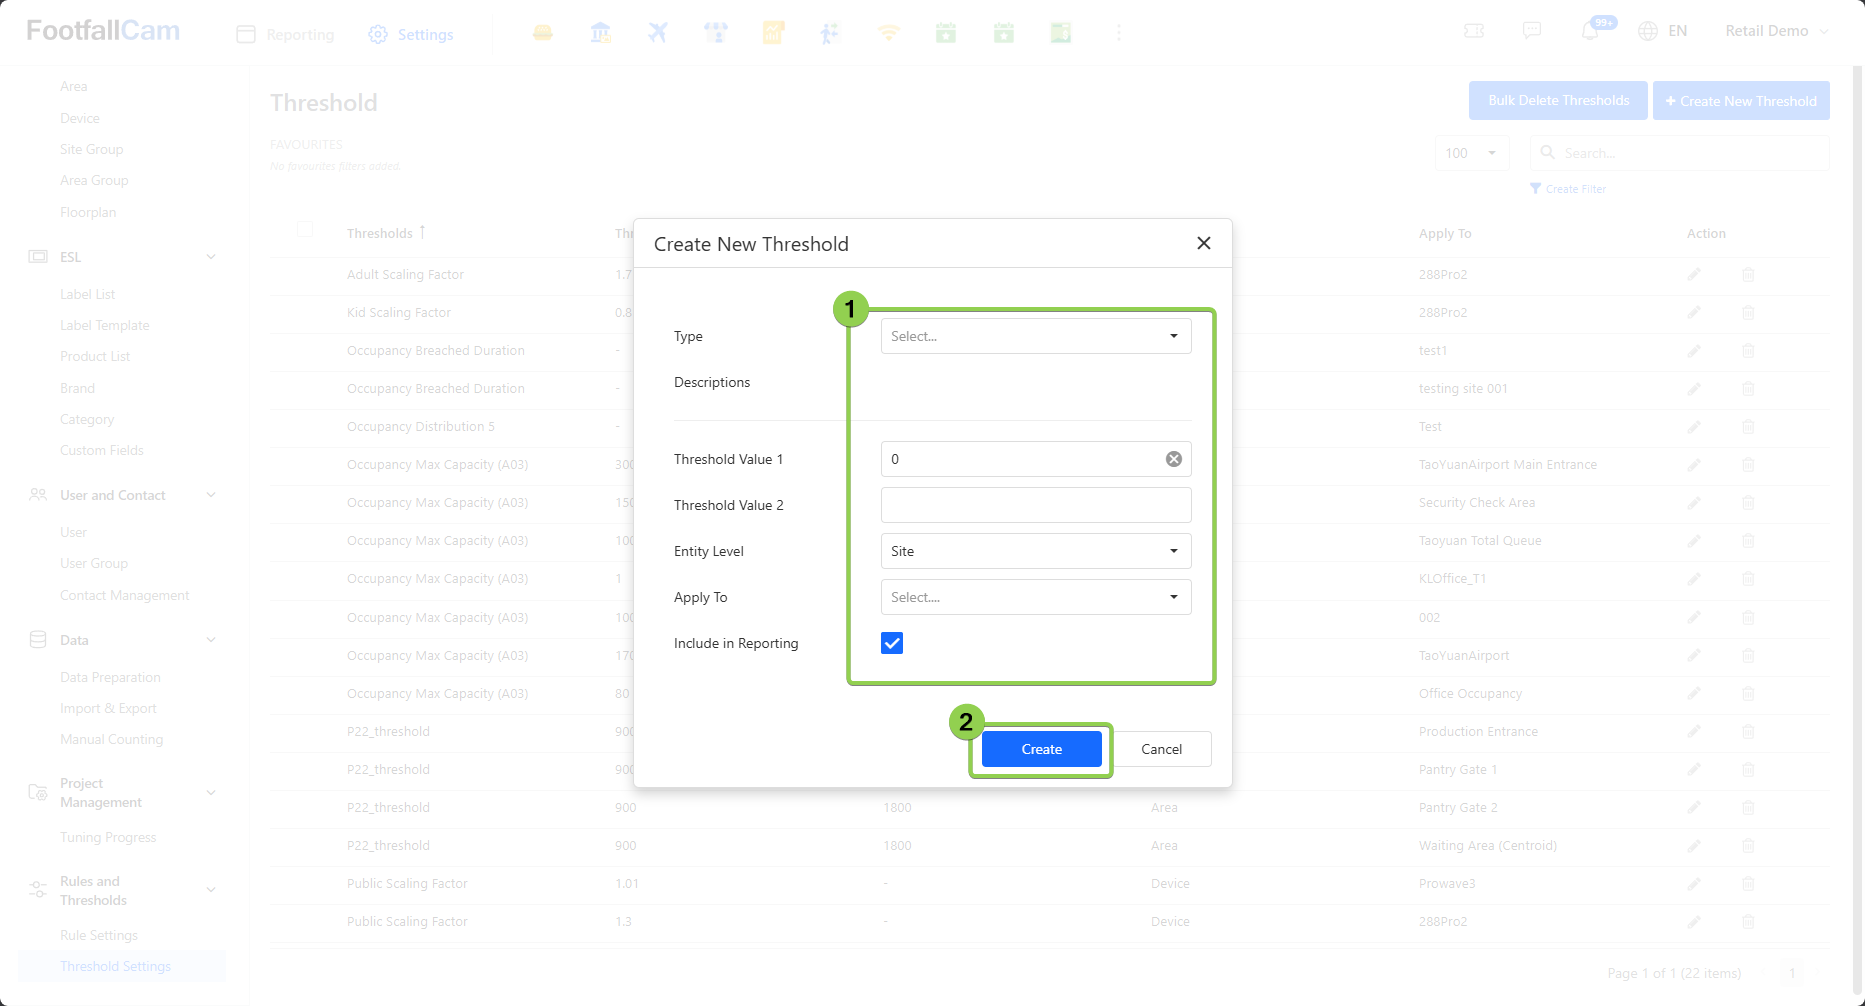
| Threshold Name | Description |
|---|---|
| Type | Select threshold type |
| Descriptions | Auto generated descriptions based on selected type |
| Threshold Value 1 | Enter threshold value 1 |
| Threshold Value 2 | Enter threshold value 2 |
| Entity Level | Select the entity level to apply the threshold |
| Apply To | Select the Site/Area/Company to apply the threshold |
Threshold Type
| Threshold Name | Description |
|---|---|
| Cleaning SLA | The SLA, in second, which trigger an alert when the washroom cleaning task breached this threshold. |
| Queue Length Max Capacity | The maximum capacity which trigger an alert when current queue length breached the threshold. |
| Min Queue Serve Duration | The minimum duration in second, to consider as a serving customer. |
| Visit Duration Scaling | The scaling for visit duration, default as 1. |
| Returning Rate Scaling | The scaling for returning rate, default as 1. |
| Washroom Usage Max Capacity | The maximum usage which trigger an alert when the current washroom usage breached this threshold. |
| Min Duration for Engagement | The minimum duration in second, to consider as an engaged customer. |
| Visit Duration Distribution 1 | Number of visitors with dwell time within [Value,Value2) in seconds. |
| Visit Duration Distribution 2 | Number of visitors with dwell time within [Value,Value2) in seconds. |
| Visit Duration Distribution 3 | Number of visitors with dwell time within [Value,Value2) in seconds. |
| Visit Duration Distribution 4 | Number of visitors with dwell time within [Value,Value2) in seconds. |
| Visit Duration Distribution 5 | Number of visitors with dwell time within [Value,Value2) in seconds. |
| Engaged Duration Distribution 1 | Number of engaged customers with engaged duration within [Value,Value2) seconds. |
| Engaged Duration Distribution 2 | Number of engaged customers with engaged duration within [Value,Value2) seconds. |
| Engaged Duration Distribution 3 | Number of engaged customers with engaged duration within [Value,Value2) seconds. |
| Engaged Duration Distribution 4 | Number of engaged customers with engaged duration within [Value,Value2) seconds. |
| Engaged Duration Distribution 5 | Number of engaged customers with engaged duration within [Value,Value2) seconds. |
| Sudden Surge in Footfall | When the footfall exceed this threshold within the duration set in Visitor IN Monitoring rule, consider a sudden surge and trigger an alert. |
| Exceeded Predicted Footfall (Percentage) | When the difference in percentage between actual footfall and predicted footfall exceed this threshold within the duration set in Visitor IN Monitoring rule, consider a huge increased and trigger an alert. |
| Approaching Capacity / Occupancy Restored | The lower capacity which trigger a warning when current occupancy breached this threshold. |
| Occupancy Max Capacity (A03) | The maximum occupancy capacity for the enclosed region, which trigger an alert when current occupancy breached this threshold. |
| Wait Time Threshold / P22_threshold | Minimum duration in second, to consider queue wait time as busy. |
| Queue Wait Time Distribution 1 | Time interval [Value,Value2) for queue wait time distribution in seconds. |
| Queue Wait Time Distribution 2 | Time interval [Value,Value2) for queue wait time distribution in seconds. |
| Queue Wait Time Distribution 3 | Time interval [Value,Value2) for queue wait time distribution in seconds. |
| Queue Wait Time Distribution 4 | Time interval [Value,Value2) for queue wait time distribution in seconds. |
| Queue Wait Time Distribution 5 | Time interval [Value,Value2) for queue wait time distribution in seconds. |
| Group Size Distribution 2 | Interval for group size distribution. |
| Group Size Distribution 3 | Interval for group size distribution. |
For more information, you may refer here.
4.2.2.2 How to Update Threshold
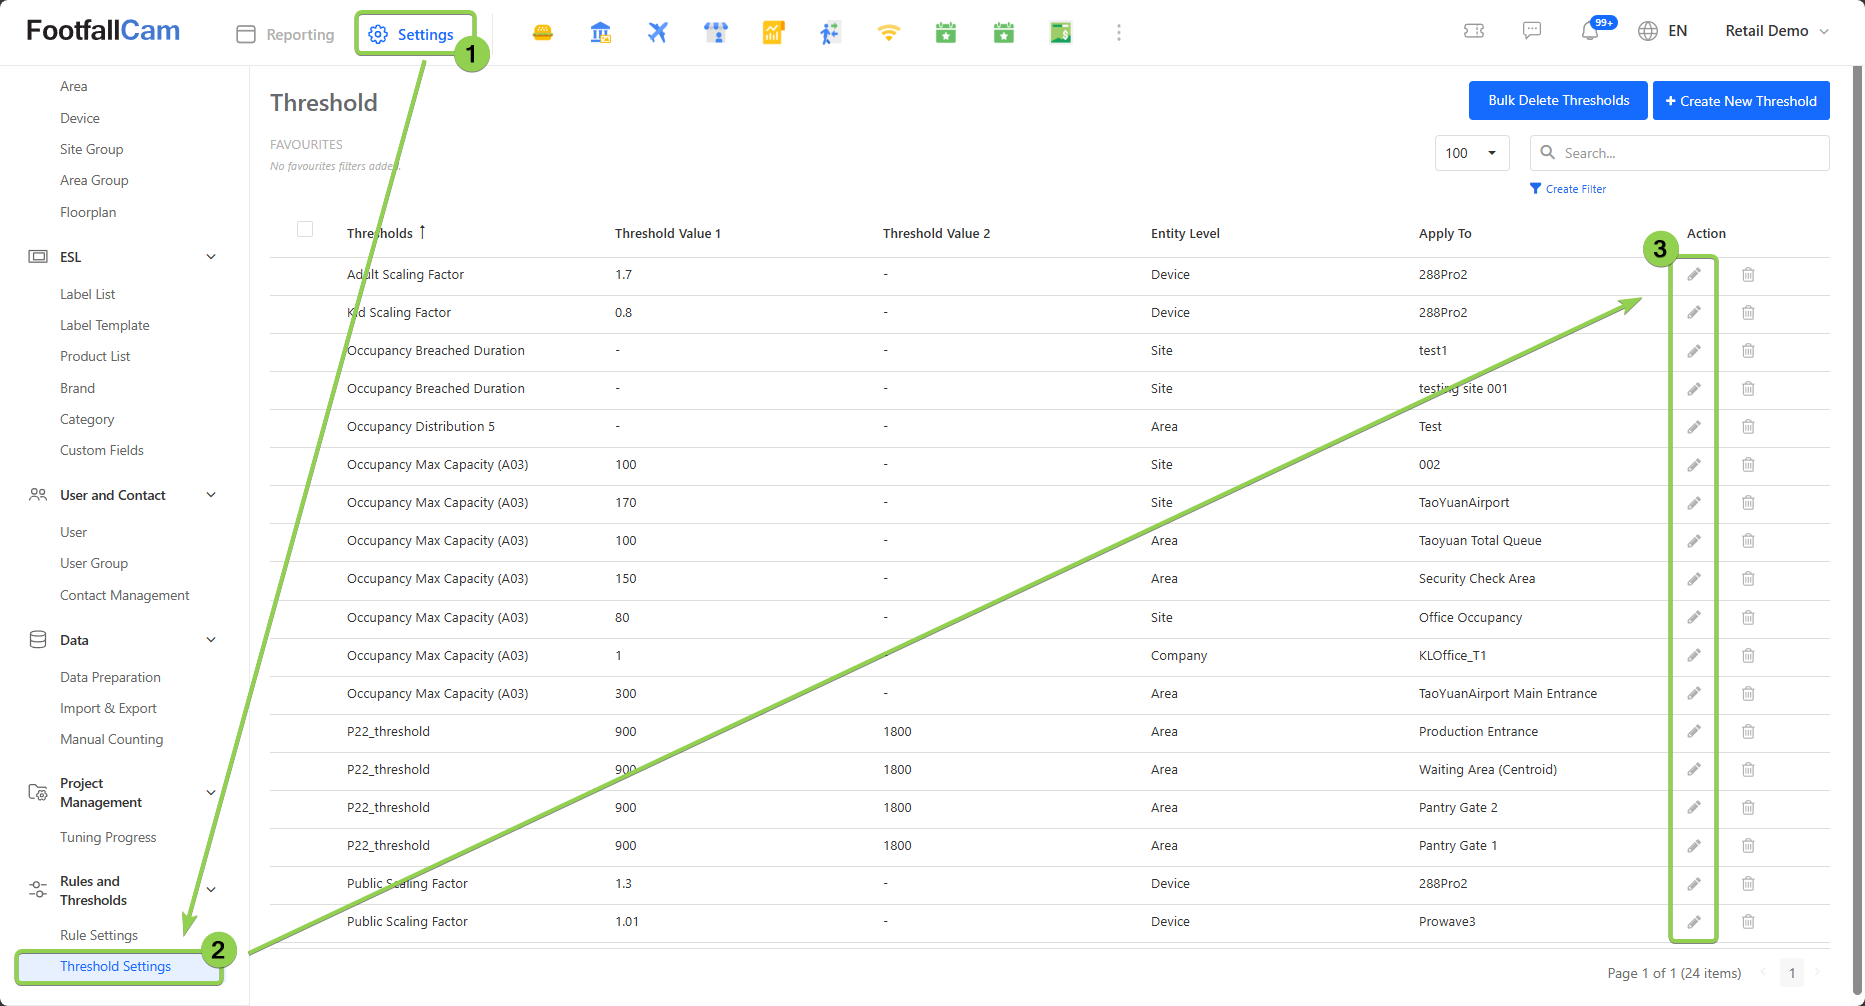
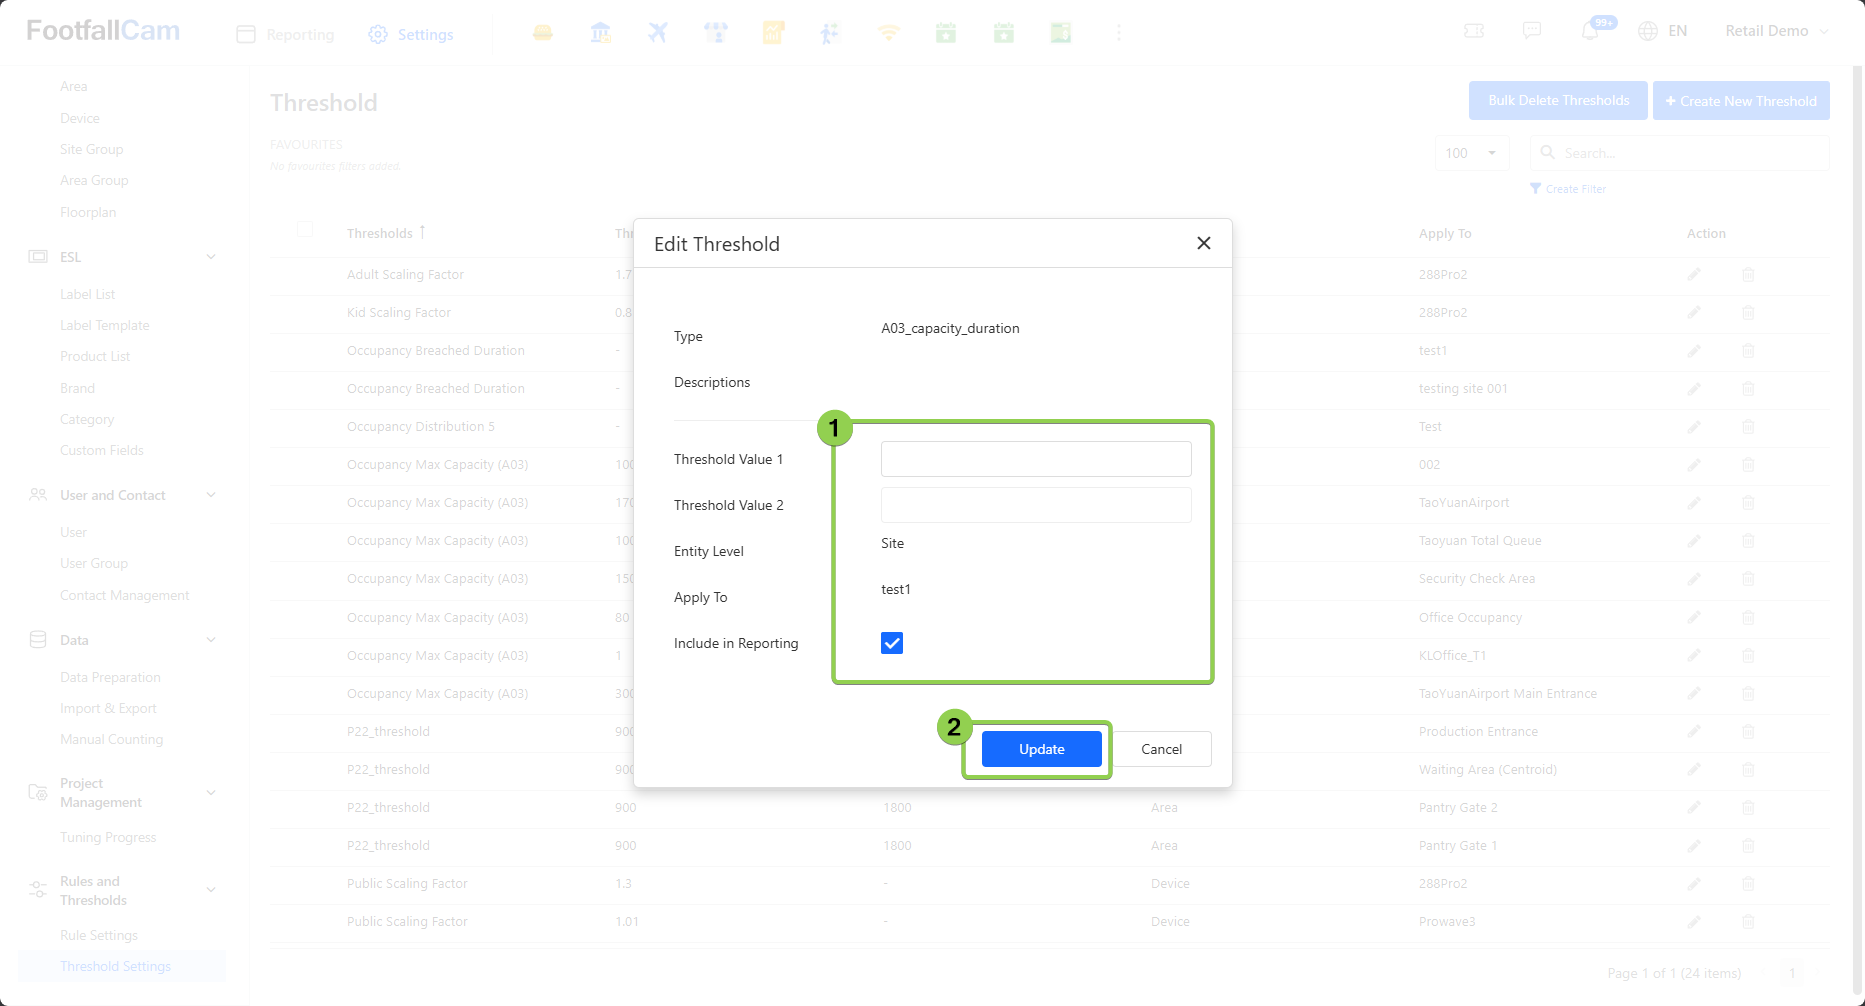
Step 1 - Go to Settings > Threshold Settings to view the existing threshold list, click on the pen icon to edit the threshold.
Step 2 - Update the threshold settings and click on "Update" button to update the changes.
4.2.2.3 How to Delete Threshold
There are two methods to delete the threshold: Delete Single Threshold and Bulk Delete Threshold.
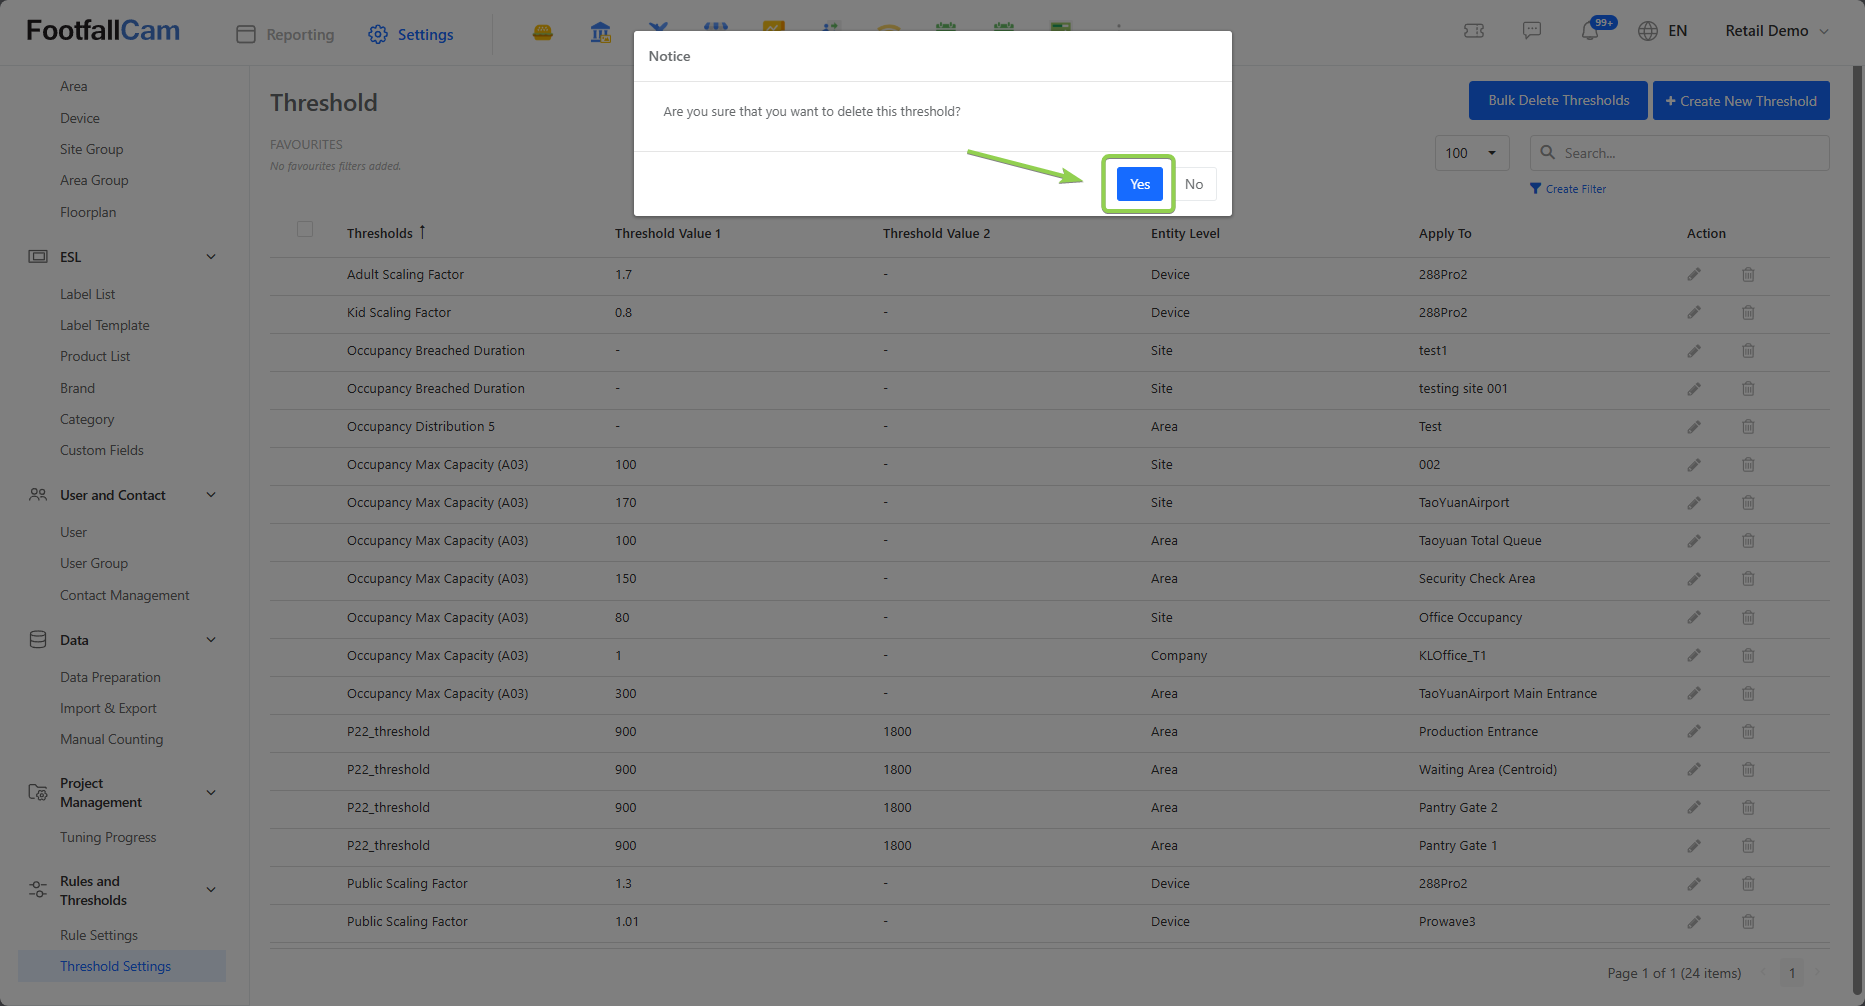
Method 1: Delete Single Threshold
Step 1 - Go to Settings > Threshold Settings to view the existing threshold list, click on the grey pen icon to delete the threshold.
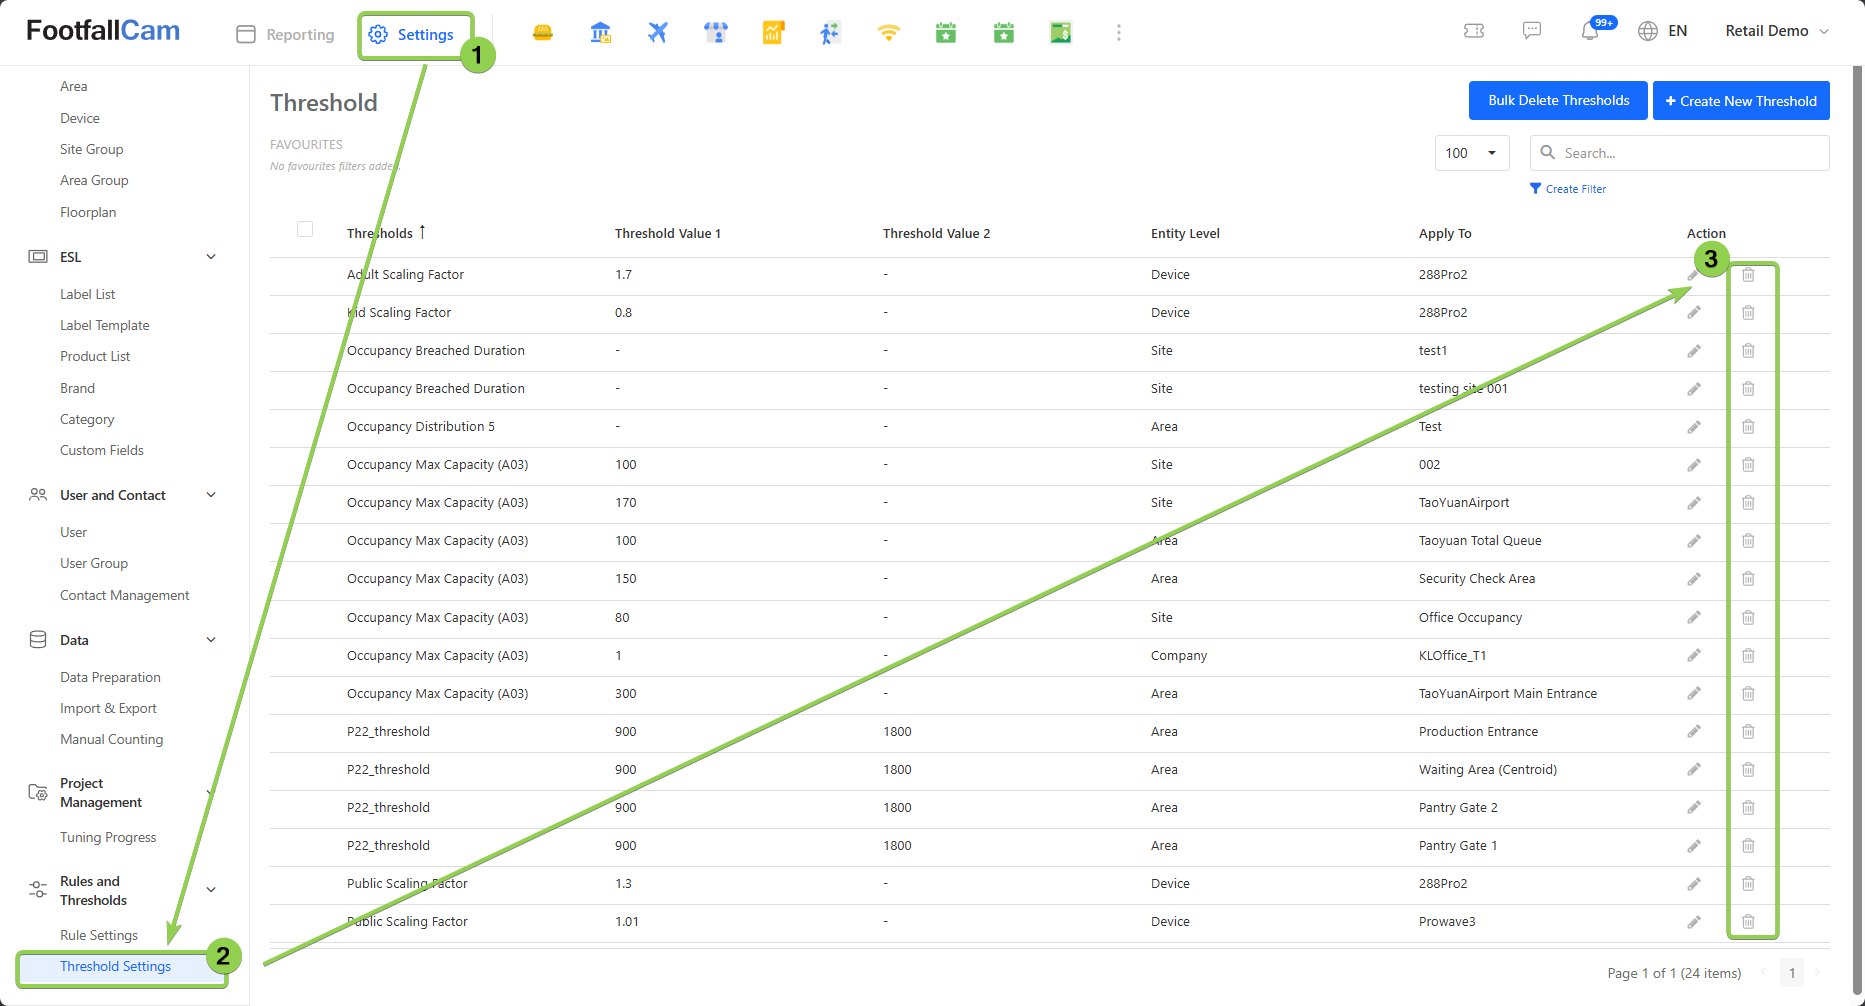
Step 2 - Click on "Yes" button to delete the threshold.
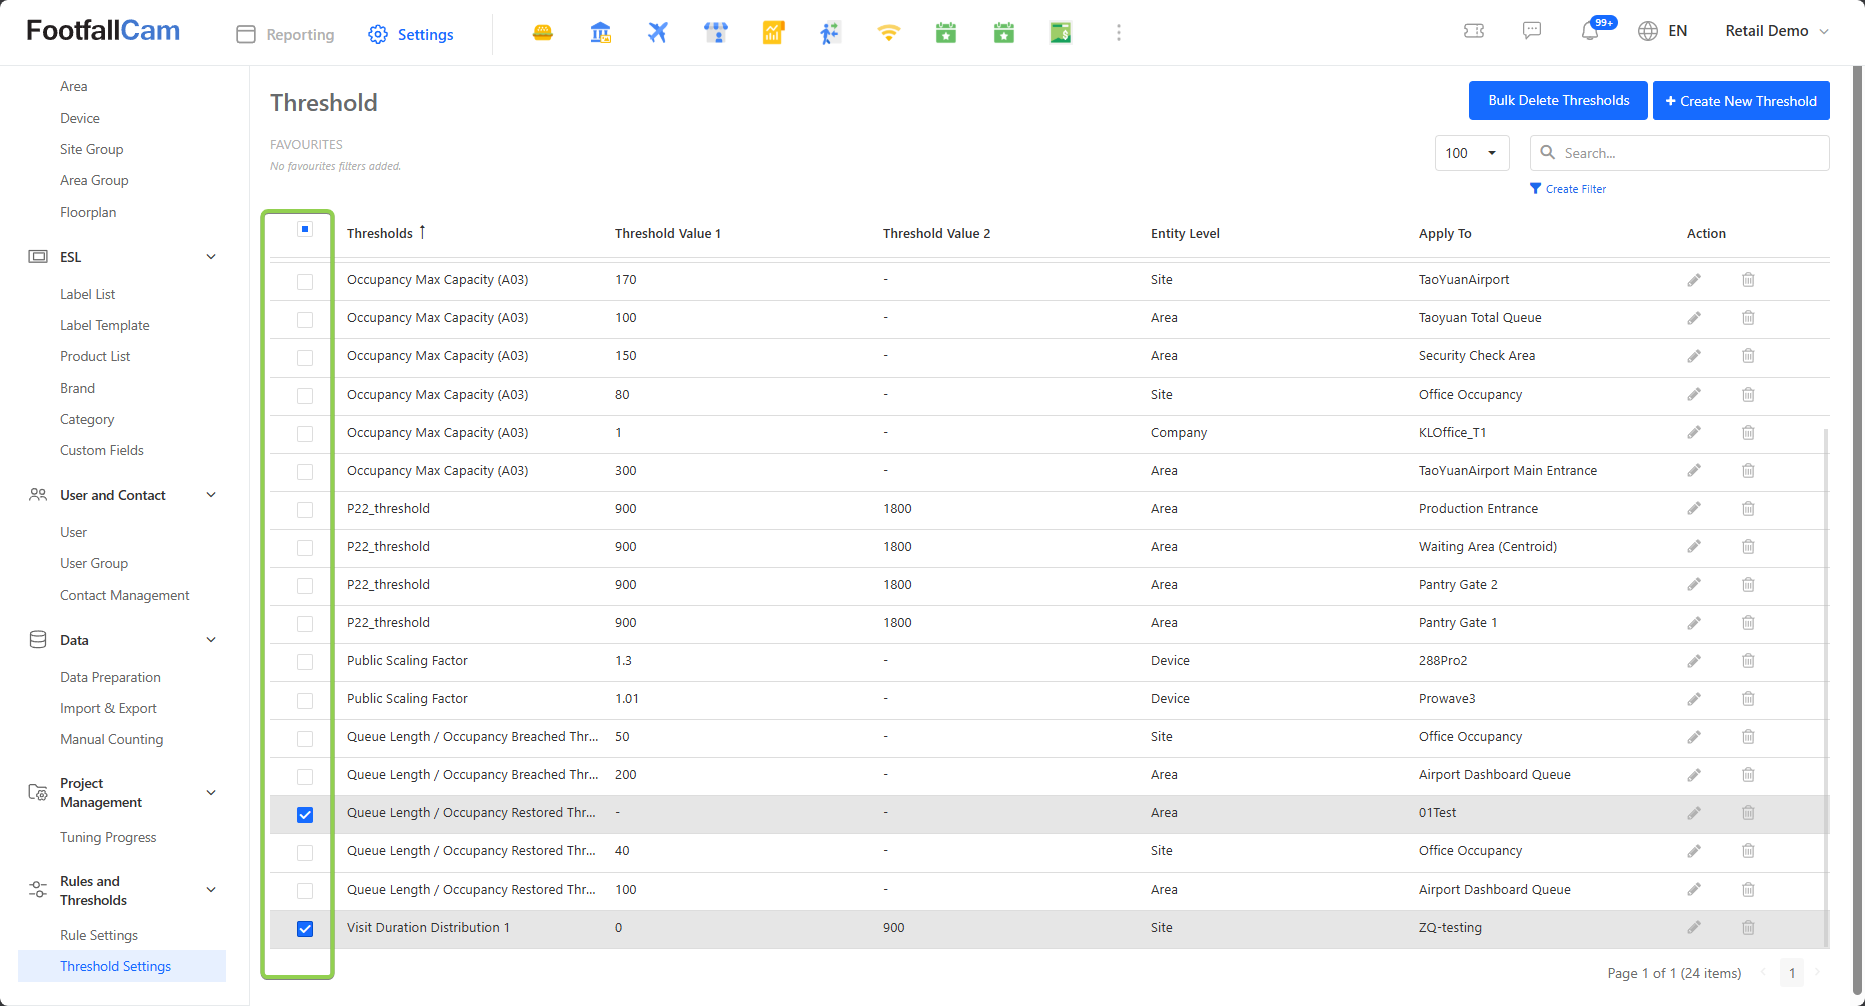
Method 2: Bulk Delete Threshold
Step 1 - Select the threshold you want to delete in the Threshold Page.
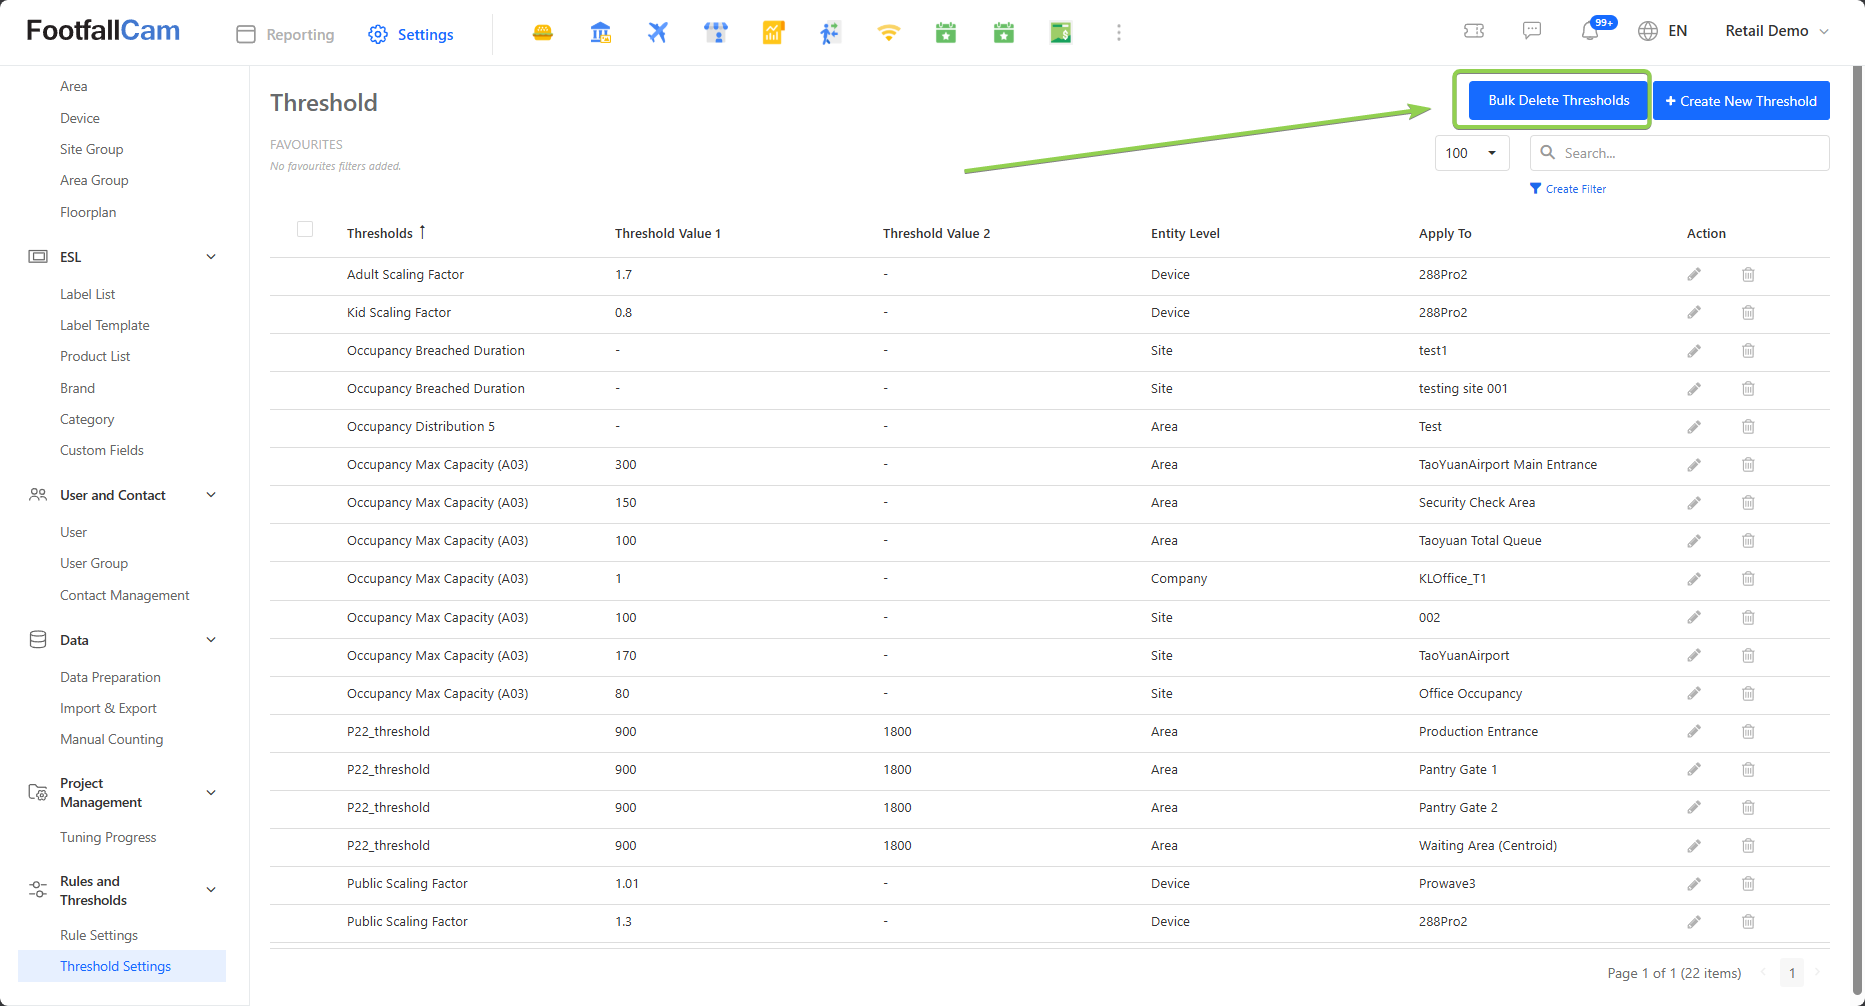
Step 2 - Click on the Bulk Delete Thresholds button.
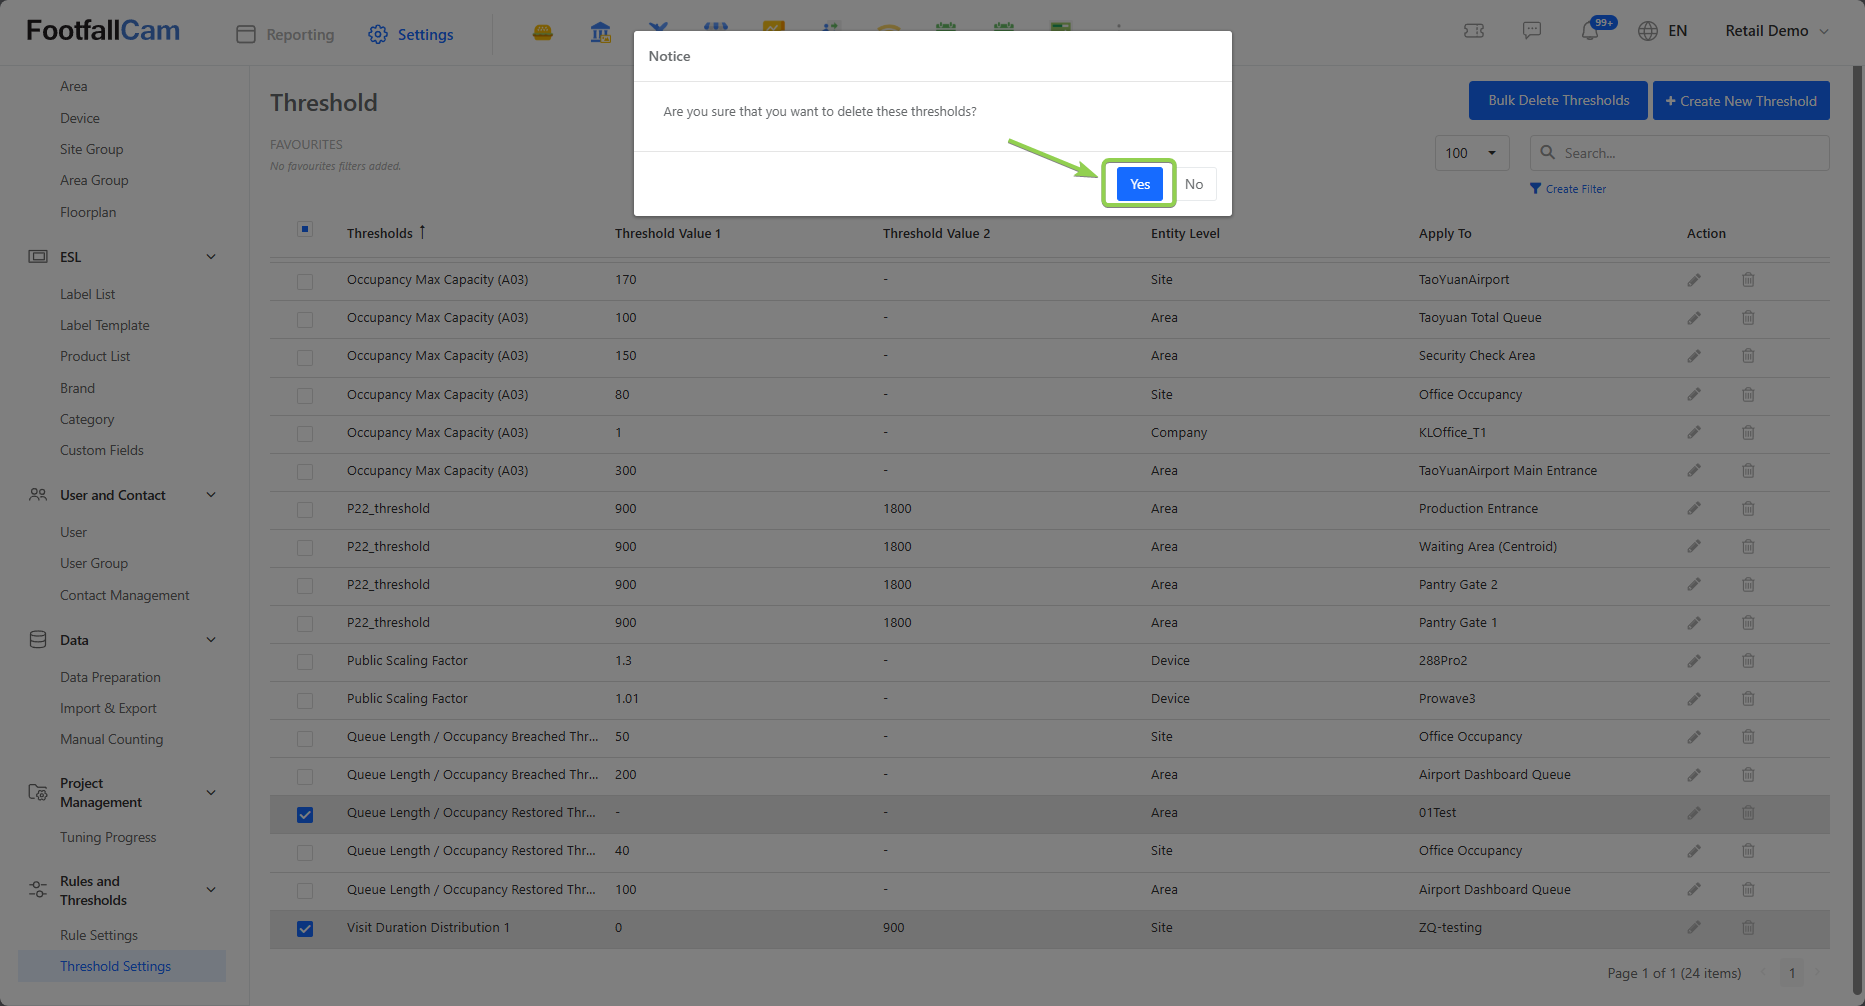
Step 3 - Click on "Yes" button to bulk delete the threshold.
4.3 Custom Dashboard
This section explains how to create a custom dashboard using the available Analytics Widgets. You can use these widgets to build dashboards tailored to your needs. For more details on the types of widgets and their usage, please refer to the section 4.1.3.
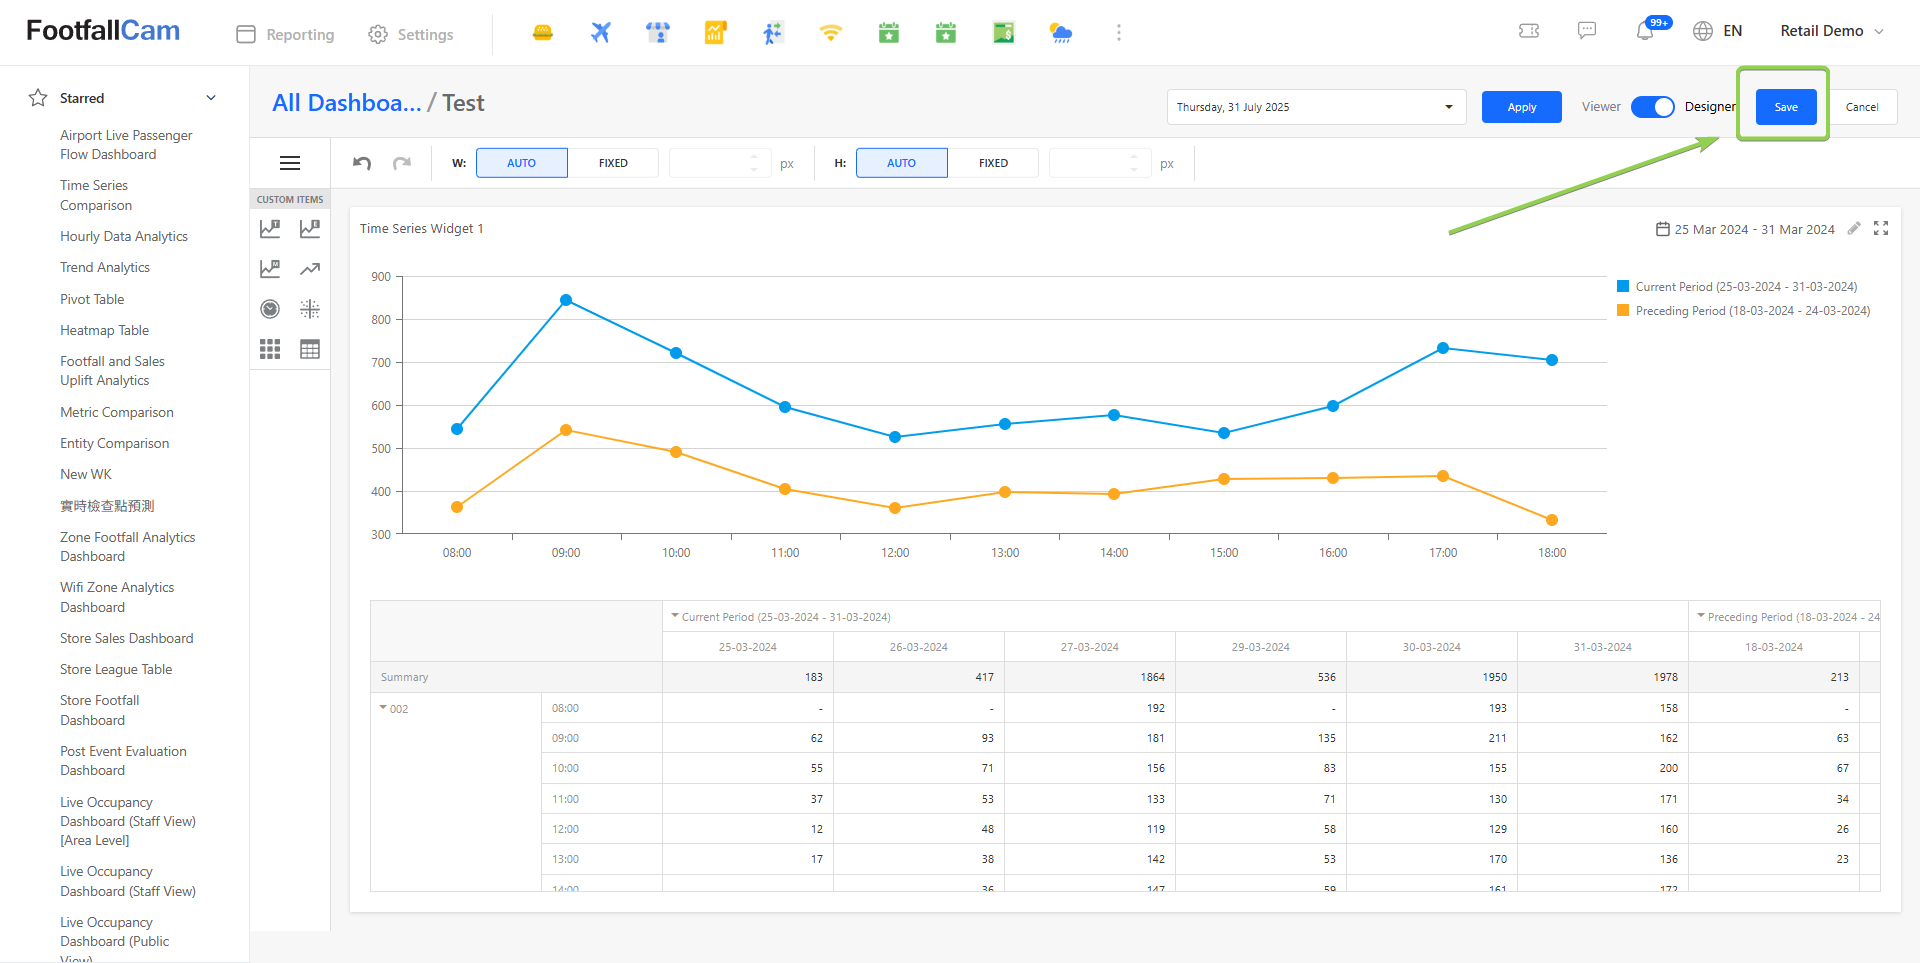
Step 1 - Go to Reporting > Analytics Widgets > select one of the analytics widget. Eg. Time Series Comparison
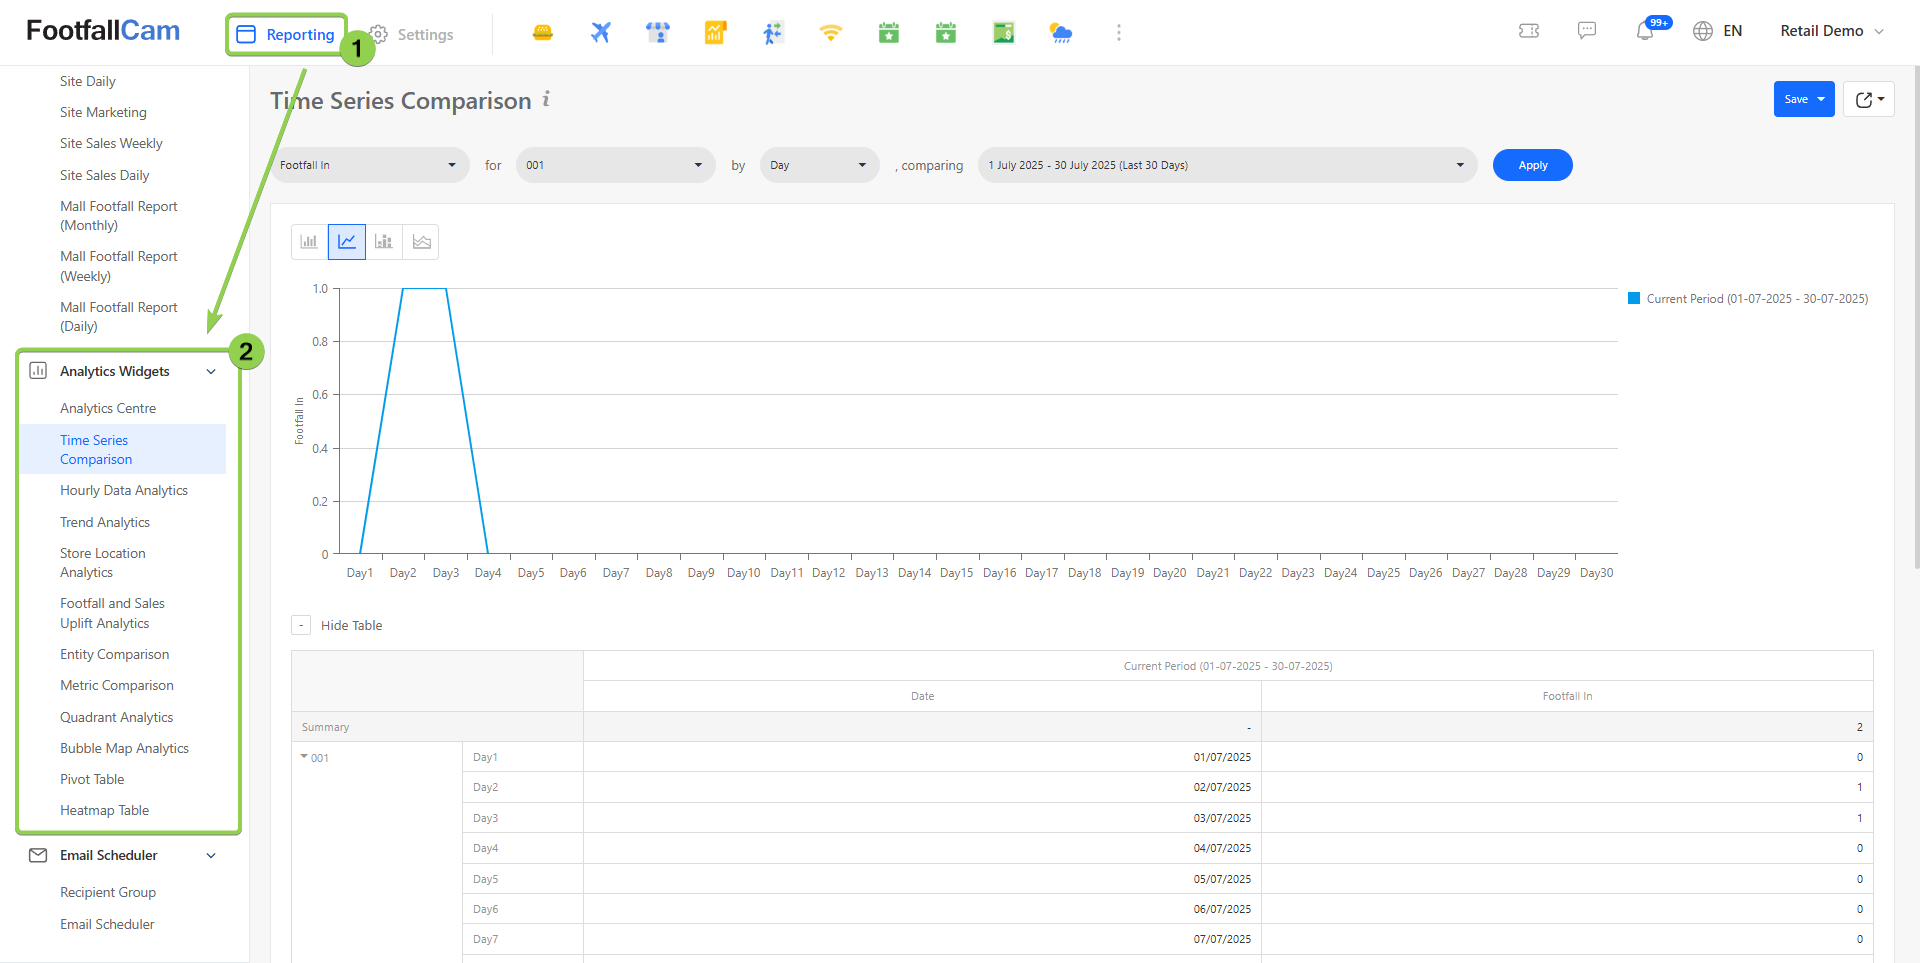
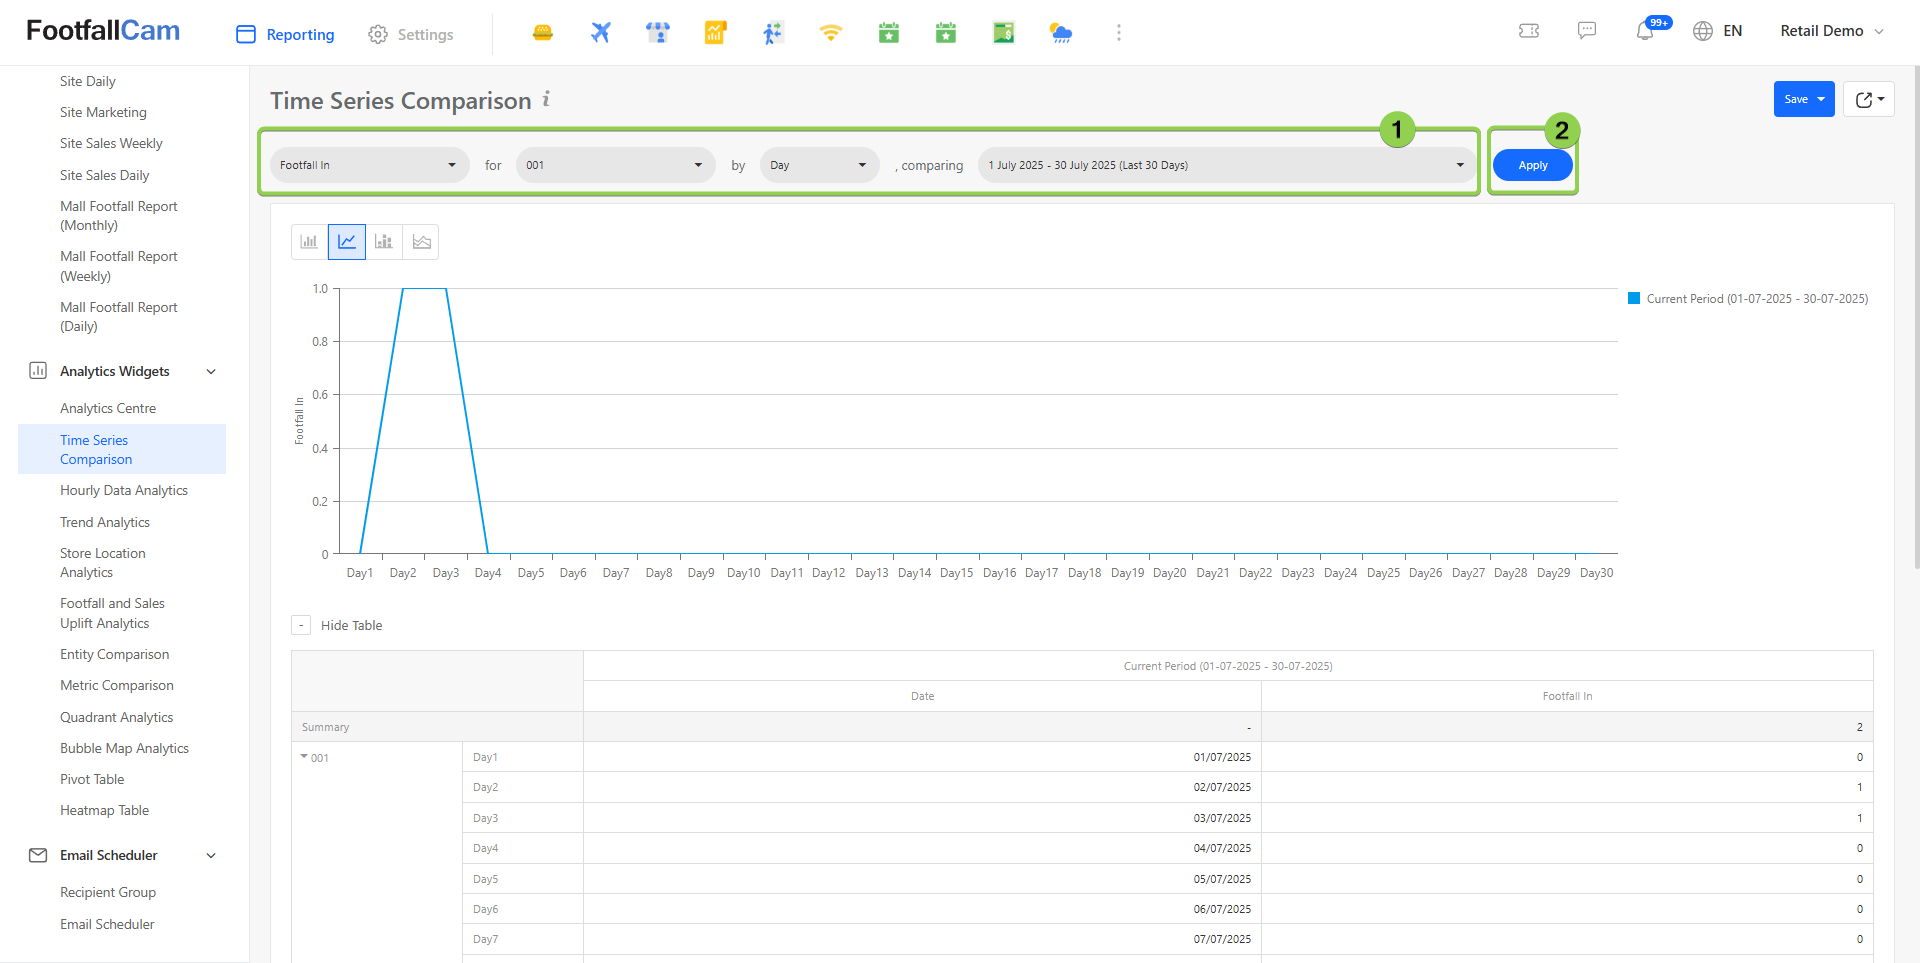
Step 2 - Select desired site, metric and the date range. Then click on Apply button to see the output.
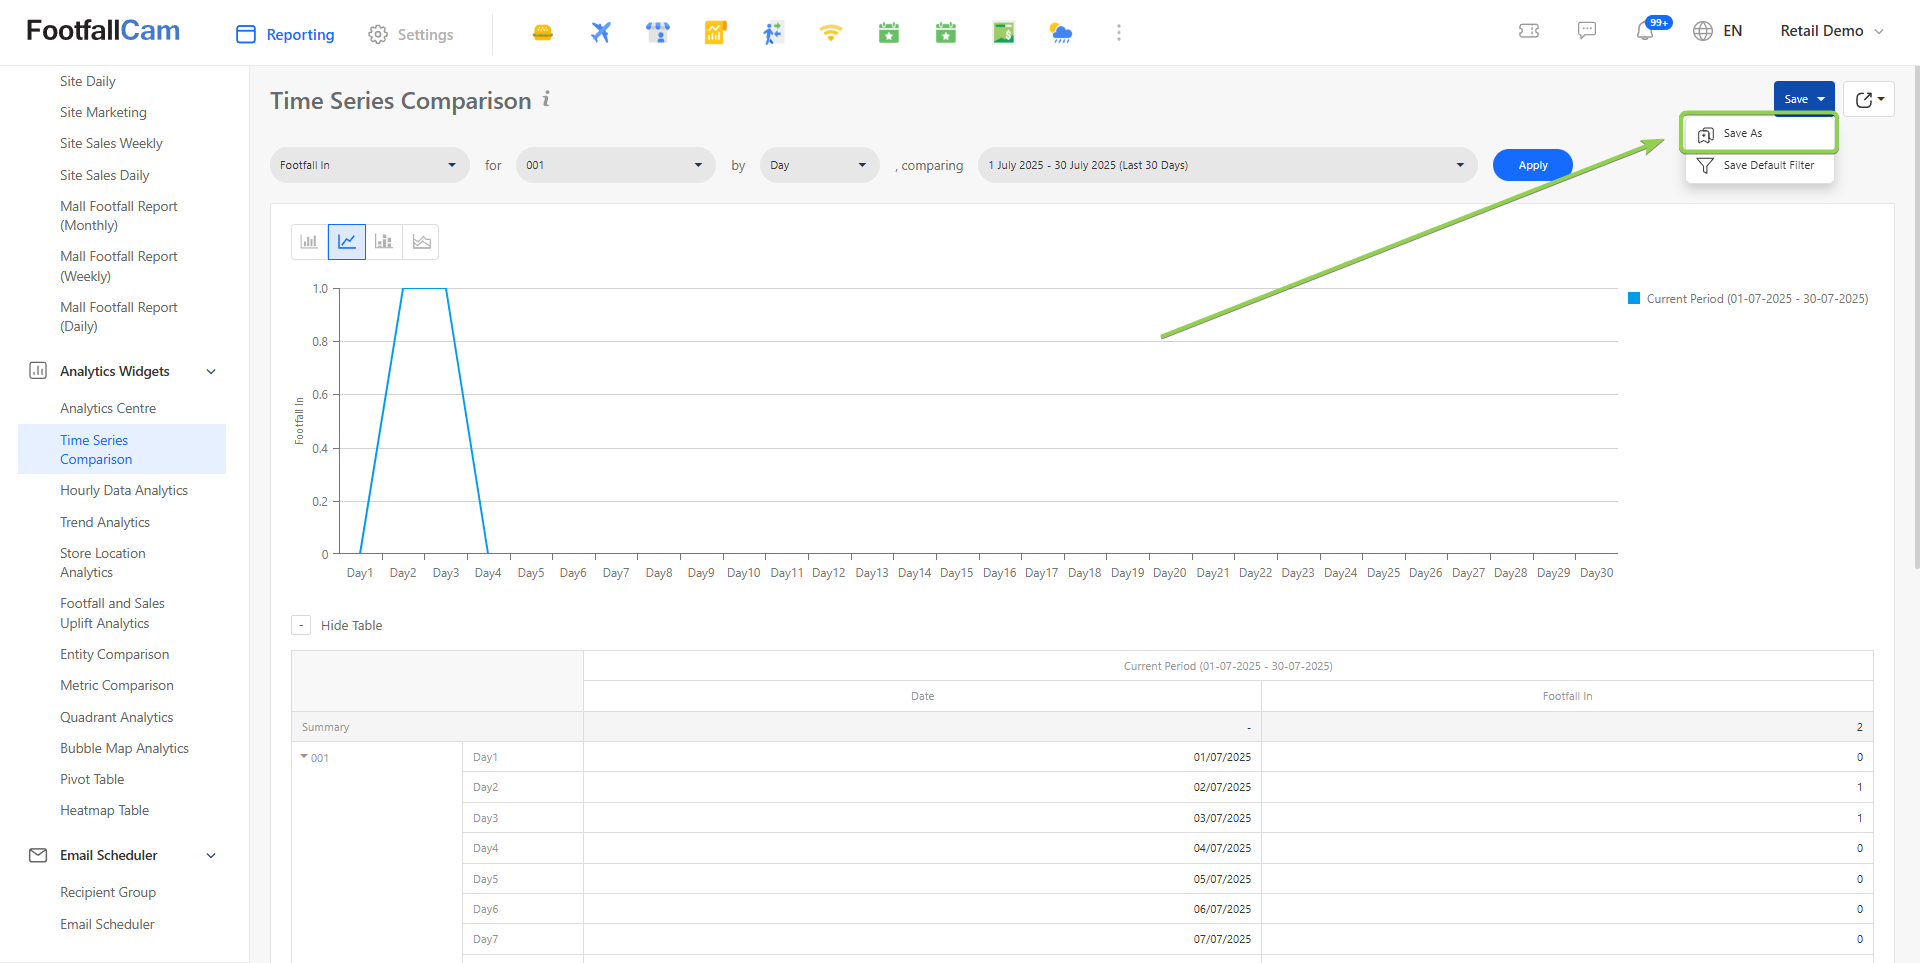
Step 3 - Click on Save button at the top and select Save As.
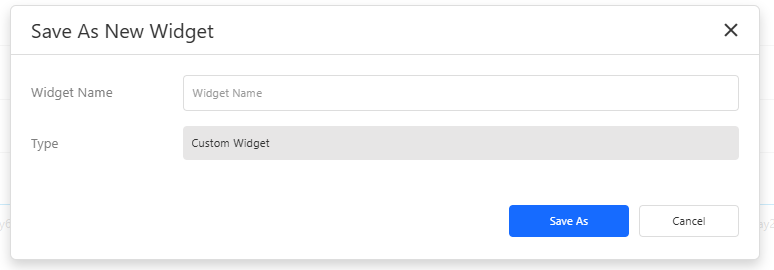
Step 4 - Name the widget.
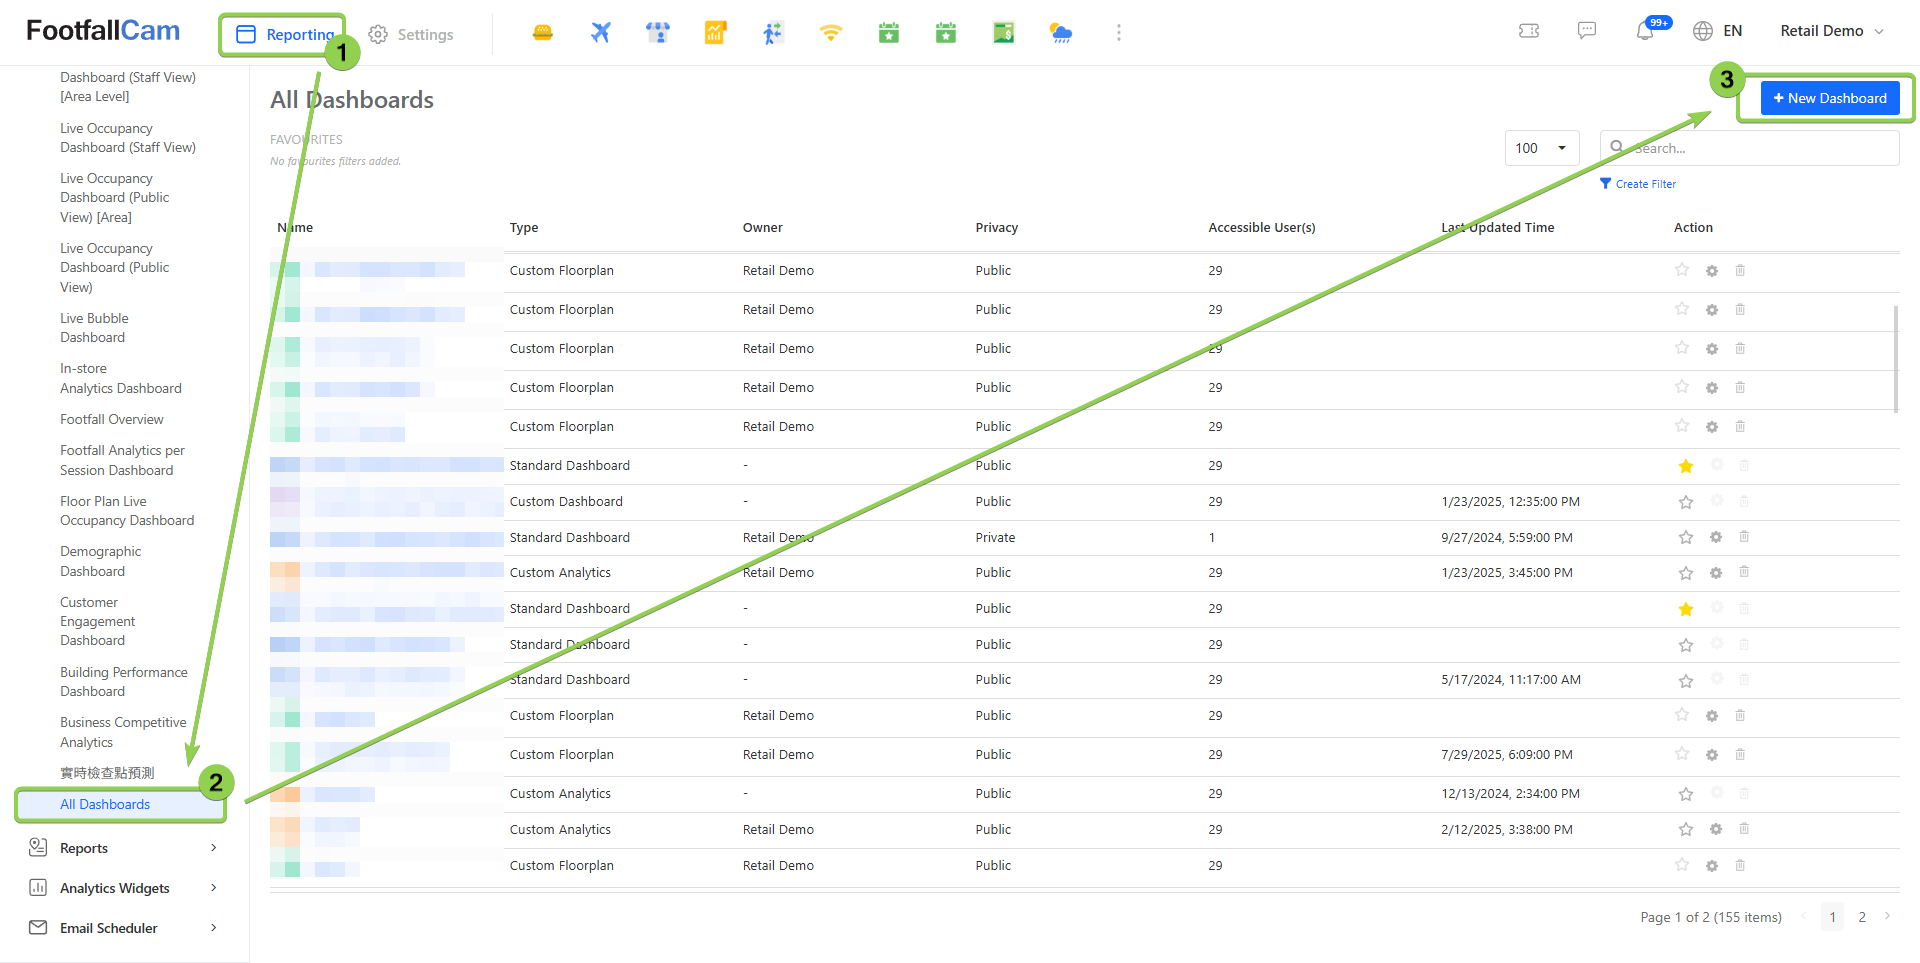
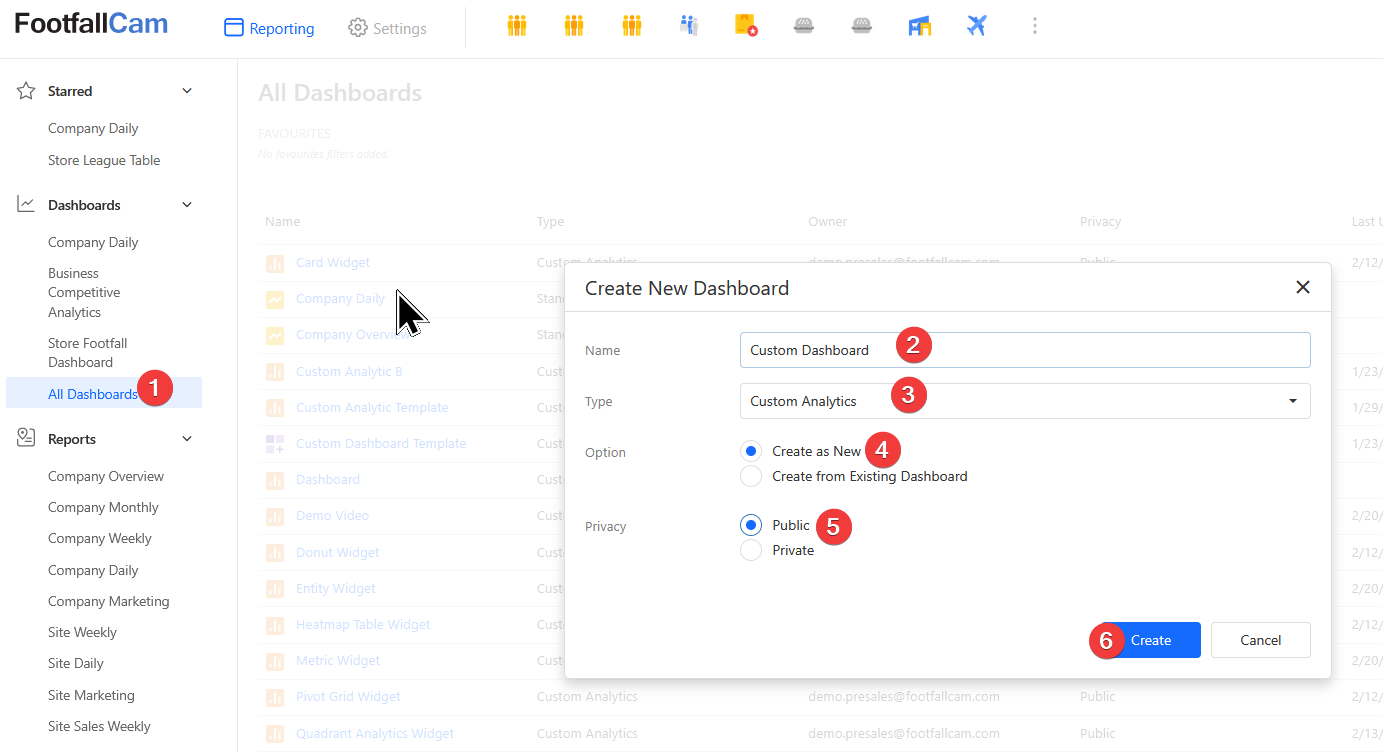
Step 5 - Go to Reporting > Dashboard > All Dashboard > Click on + New Dashboard
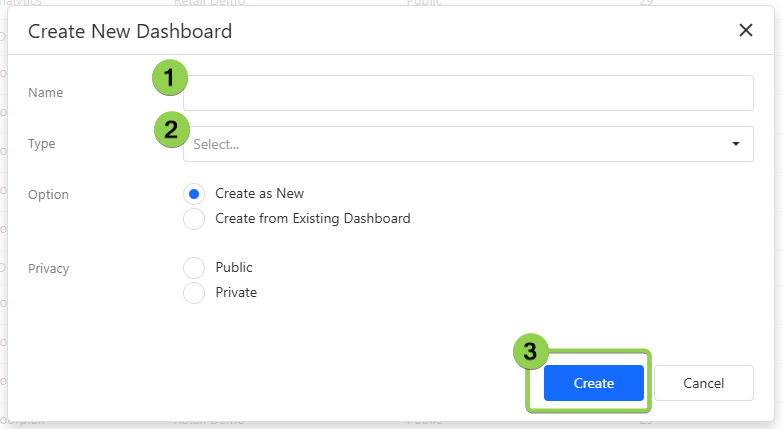
Step 6 - Fill in your dashboard name and select type as Custom Analytics.
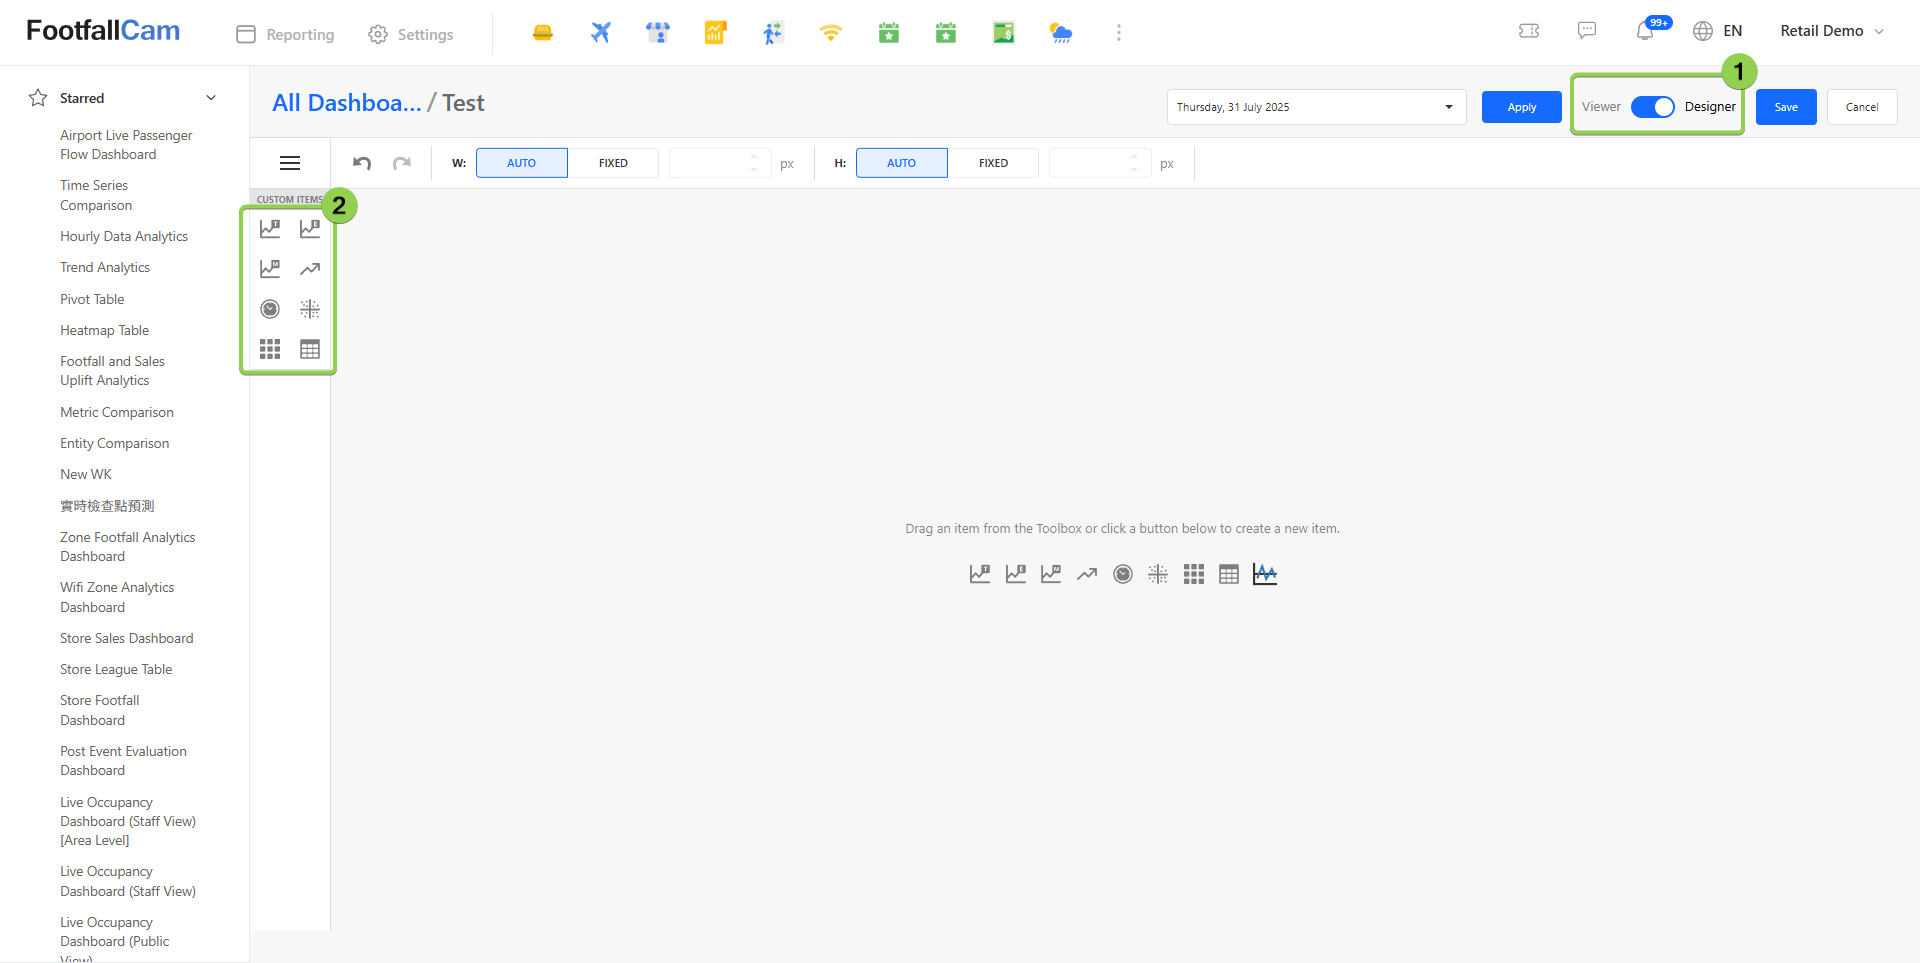
Step 7 - Click on switch to designer > select the expected widget icon on the left side bar.
Step 8 - Click on option and select the widget that you saved.
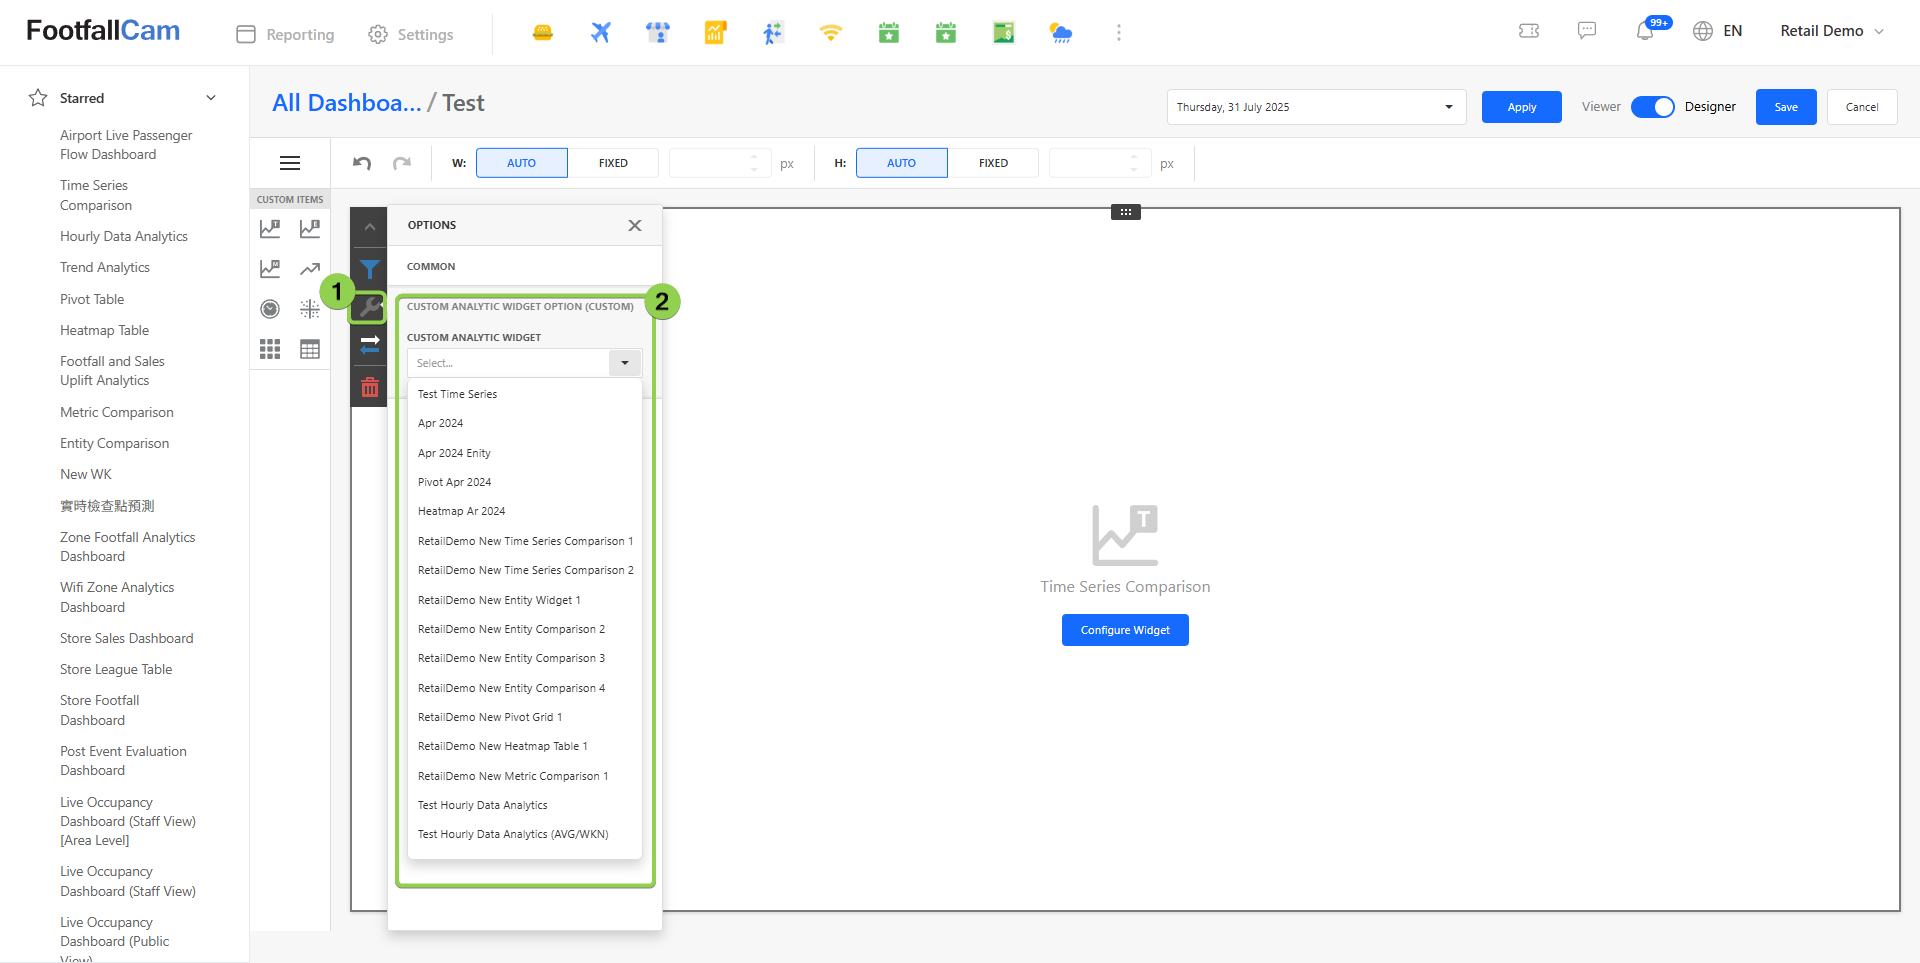
Step 9 - Click Save and refresh.
*Note: All analytics widgets can be saved except Analytics Centre, Store Location Analytics, Footfall and Sales Uplift Analytics.*
4.3.1 Overview
The Custom Dashboard feature allows users to build personalized analytics dashboards using a collection of available Analytics Widgets. These widgets enable users to visualize operational data, monitor performance indicators, and track trends in real time.
By combining multiple widgets in a single dashboard, users can quickly obtain insights relevant to their role, department, or operational needs. Dashboards can be customized with filters, layouts, and data views to ensure that the most important metrics are easily accessible.
4.3.2 General Guideline
When creating a custom dashboard, users can select from various widget types and configure them according to their data requirements. Each widget provides a unique way of visualizing analytics data.
To create a dashboard:
- Navigate to the All Dashboard section.
- Click New Dashboard.
- Provide a Dashboard Name , select type as custom analytics and select privacy as public for every user for the company to have access.
- Click on create and it will redirect you to the created empty dashboard view.
How Filters Work
Filters allow users to restrict the data displayed in a widget based on selected parameters such as date range, entity, or category.
When a widget is saved, the selected filters become the default configuration for that widget.
For example, if a widget is configured with the "Last Month" filter and the dashboard-level filter is set to January 2026, the widget will display data for December 2025, which is the previous month relative to the selected dashboard filter.
Users can adjust filters dynamically while viewing the dashboard to explore different data.
However, these changes are temporary and will not overwrite the widget's saved filter configuration unless the widget is edited and saved again.
Widgets configured with a Custom Range use a fixed date range. Dashboard-level filters will not affect these widgets.
4.3.3 Widgets
Widgets are modular analytics components that allow users to visualize different types of data within the dashboard. Each widget type serves a specific purpose and supports different visualization methods.
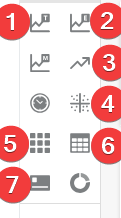
Widget type :
- Time Series Widget
- Entity Widget
- Trend Analytics Widget
- Quadrant Widget
- Heatmap Table Widget
- Pivot Grid Widget
- Card Widget
4.3.3.1 Card Widget
The Card Widget displays key metrics in a simple card format. It is typically used to highlight important summary statistics such as totals, averages, or performance indicators.
Common use cases include:
- Footfall In / Out
- Turn In Rate
- Visit Duration
Card widgets are best suited for displaying single-value metrics that need to be easily visible at a glance.
How to configure card widget :
Follow these steps to configure a Card Widget on your dashboard:
-
Add the Widget Drag and drop the Card Widget icon from the left sidebar onto your dashboard.
-
Open Configuration Click Configure Widget to open the widget settings.
-
Select Data
- Choose the entity you want to analyze.
- Set the date range for the widget.
- Click Add Metric to select the metrics you want to display (maximum 7 metrics per card).
-
Customize Display Names Optionally, edit the display name for each metric to make it more meaningful or user-friendly.
-
Preview Click Preview to verify that the widget displays the data as intended.
-
Save Click Save to finalize the widget configuration. You will be redirected back to your dashboard, where the new card widget will be displayed.
4.3.3.2 Heatmap Widget
The Heatmap Widget visualizes data intensity using color gradients. This widget is useful for identifying patterns, peaks, and low-activity areas within a dataset.
Darker or more intense colors typically represent higher values or concentrations.
Follow these steps to configure a Heatmap Widget on your dashboard:
-
Add the Widget Drag and drop the Heatmap Widget icon from the left sidebar onto your dashboard.
-
Open Configuration Click Configure Widget to open the widget settings.
-
Select Data
- Choose the datasets you want to use.
- Set the date range for the widget.
- Drag and drop the desired fields into Rows and Columns to define the table layout.
- Drag the metric(s) you want to visualize into the Series section.
-
Save Click Save to finalize the widget configuration. You will be redirected back to your dashboard, where the new heatmap widget will be displayed.
4.3.3.3 Entity Widget
The Entity Widget displays analytics data grouped by entities such as sites, devices, or areas.
This widget helps users:
- Compare performance across multiple sites
- Identify top-performing or underperforming sites
- Monitor entity-specific metrics
Follow these steps to configure an Entity Widget on your dashboard:
-
Add the Widget Drag and drop the Entity Widget icon from the left sidebar onto your dashboard.
-
Open Configuration Click Configure Widget to open the widget settings.
-
Configure the Widget Settings
- Select the metrics you want to display.
- Choose the time granularity for the data (for example: hourly, daily, or monthly).
- Set the date range for the widget.
- Select the sites or entities you want to compare.
- Choose the chart type you want to use for visualization.
-
Apply Settings Click Apply to preview the widget.
You can also choose whether to show or hide the data table before saving the widget. -
Save the Widget Click Save to finalize the widget configuration. You will be redirected back to your dashboard, where the new Entity Widget will be displayed.
4.3.3.4 Pivot Widget
The Pivot Widget provides a dynamic data table that allows users to analyze data across multiple sites / areas / devices and metrics .
With pivot functionality, users can:
- Group data by rows and columns
- Perform multi-dimensional sites / areas / devices
Follow these steps to configure a Pivot Widget on your dashboard:
-
Add the Widget Drag and drop the Pivot Widget icon from the left sidebar onto your dashboard.
-
Open Configuration Click Configure Widget to open the widget settings.
-
Configure the Widget
- Choose the dataset you want to use.
- Select the date range for the widget.
- Drag and drop the desired fields into Rows and Columns to define the table layout.
- Drag the metric(s) you want to visualize into the Series section.
-
Preview the Widget Click Apply to preview how the widget will appear.
-
Save the Widget Click Save to finalize the widget configuration. You will be redirected back to your dashboard, where the new Pivot Widget will be displayed.
Graph visualization is not available when multiple metrics are selected.
4.3.3.5 Quadrant Widget
The Quadrant Widget displays data points in a four-quadrant chart based on two measurement axes.
This visualization is commonly used for:
- Footfall vs. Total Sales Revenue comparisons
- Target Population vs. Footfall comparisons
- Outside Traffic vs. Footfall comparisons
Each quadrant helps users quickly identify patterns and categorize entities based on the selected metrics.
Follow these steps to configure a Quadrant Widget on your dashboard:
-
Add the Widget Drag and drop the Quadrant Widget icon from the left sidebar onto your dashboard.
-
Open Configuration Click Configure Widget to open the widget settings.
-
Configure the Analysis
- Select the analysis comparison you want to use.
- Choose the sites or entities you want to compare.
- Set the date range for the analysis.
-
Preview the Widget Click Apply to preview the data and ensure the visualization matches your requirements.
-
Save the Widget Click Save to finalize the widget configuration.
You can choose to save both the graph and grid view, or the graph only.
4.3.3.6 Time Series Widget
The Time Series Widget visualizes data trends over a selected time period.
It is commonly presented as a line chart or area chart, allowing users to observe how metrics change over time.
Typical uses include:
- Monitoring daily or hourly footfall trends
- Tracking metrics over time
- Observing seasonal or periodic patterns
Users can adjust the time range filter to view different time intervals.
Follow these steps to configure a Time Series Widget on your dashboard:
-
Add the Widget Drag and drop the Time Series Widget icon from the left sidebar onto your dashboard.
-
Open Configuration Click Configure Widget to open the widget settings.
-
Configure the Widget
- Select the metrics you want to display.
- Choose the site(s) or entities to analyze.
- Set the time granularity (e.g., hourly, daily, weekly).
- Select the comparison period if needed.
- Pick the graph type for visualization.
- Click Apply to preview the widget.
-
Save the Widget Click Save to finalize the configuration. You can choose to save only the graph or both the graph and the table.
After saving, the new Time Series Widget will appear on your dashboard.
4.3.3.7 Trend Analytics
The Trend Analytics Widget focuses on identifying patterns, growth, or decline within datasets.
This widget helps users:
- Identify long-term trends
- Compare historical data
- Monitor performance improvements or drops
Follow these steps to configure a Trend Widget on your dashboard:
-
Add the Widget Drag and drop the Trend Widget icon from the left sidebar onto your dashboard.
-
Open Configuration Click Configure Widget to open the widget settings.
-
Configure the Widget
- Select the entities or sites you want to analyze.
- Choose the metric you want to track the trend for.
- Pick the default date ranges for the trend analysis.
- Choose whether to show or hide the data table.
- Click Apply to preview the widget.
-
Save the Widget Click Save to finalize the configuration. You will be redirected back to your dashboard, where the new Trend Widget will be displayed.
----