Staff Exclusion
1.0 Staff Exclusion
The Staff Exclusion Validation Workspace is designed to help users verify and improve the accuracy of staff exclusion within the people counting system.
In many retail environments, employees may tend to move in and out of the store during their shifts. Without proper identification and exclusion, staff movements may be incorrectly counted as shopper traffic, which can significantly distort analytics such as:
- Actual customer footfall in
- Store conversion rates
- Customer traffic trends
This section focuses on how users can validate, benchmark, and confirm that staff members are correctly excluded from shopper traffic counts using annotated images and comparison tools, whilst feeding the model accurate data to improve future predictions.
The system will automatically generate machine-inferred predictions that estimate whether a person entering the store is a staff member or a visitor based on an AI model. However, validation can be done:
- If there are doubts about the accuracy of the machine-inferred results.
- To help improve our future predictions for a specific site by correctly identifying staff and visitors for further model training.
- To understand the different movement trends of customers and visitors in a store.
The process of the Validation Workspace enables users to compare our current machine predictions with ground truth annotations collected from scheduled image campaigns, and users can review differences and determine whether the model is accurately distinguishing staff from visitors via graphs, summaries, and path analysis tools, to name a few.
By analysing this data, users can validate the effectiveness of staff exclusion and improve the reliability of shopper traffic metrics for their store environment.
1.1 Overview
Users can use the Overview Section to obtain an overall high-level summary of the number of staff being predicted and excluded when entering the store. This page also provides a visual comparison between machine-inferred predictions and ground truth annotations, allowing users to quickly evaluate model performance and identify discrepancies.
The data is presented through a series of charts and summary panels that highlight:
- Hourly distribution of staff and visitors
- Total visitor and staff predictions in a day
- Differences between machine-inferred results and annotated data
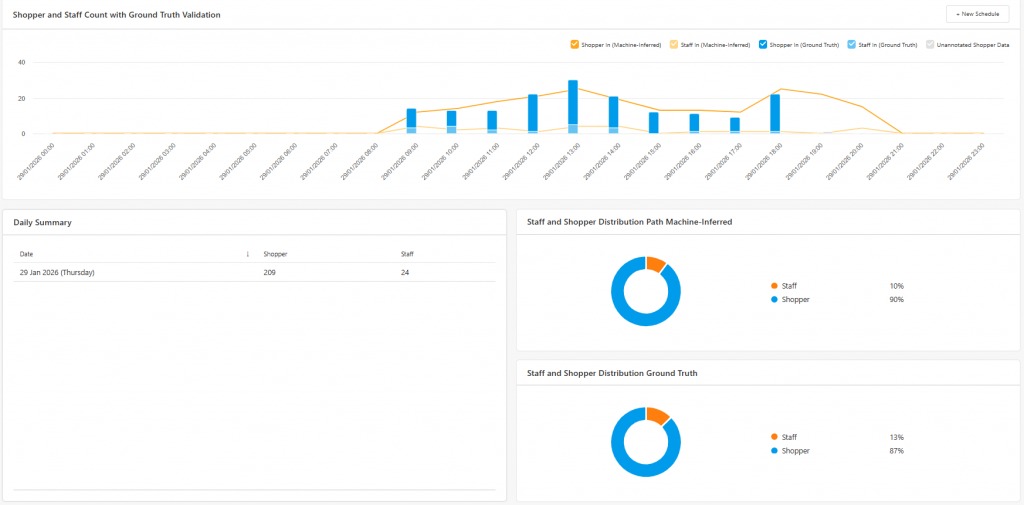
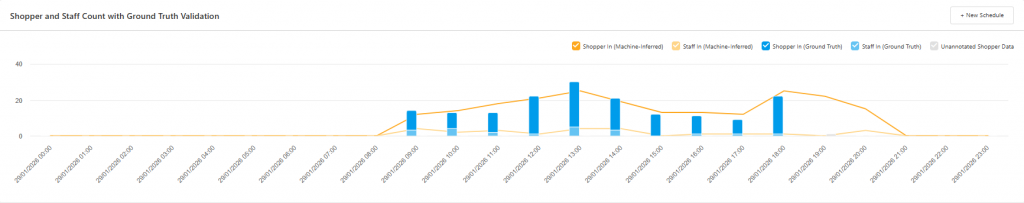
The validation graph compares the number of annotated images (Ground Truth) against the machine-inferred predictions.
This comparison allows users to identify potential differences between:
- Predicted staff counts
- Actual staff counts identified during manual annotation
These differences can be analysed on an hourly basis, helping users determine whether the model consistently misclassifies individuals during certain periods of the day.
Users can also view a daily summary of machine-inferred predictions of the number and trend of the shoppers and staff by selecting a date range, as demonstrated in the picture below. This summary shows the overall trend of predicted staff and visitors.
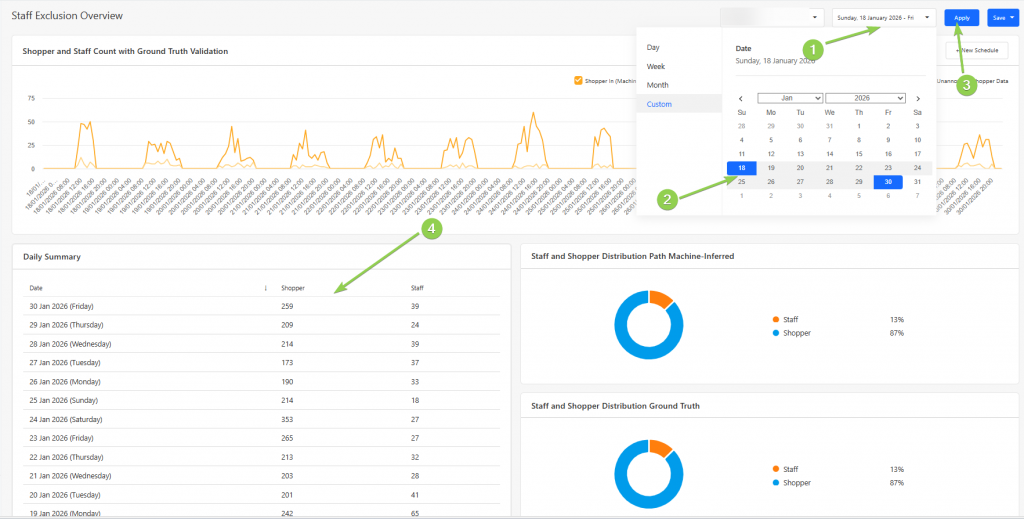
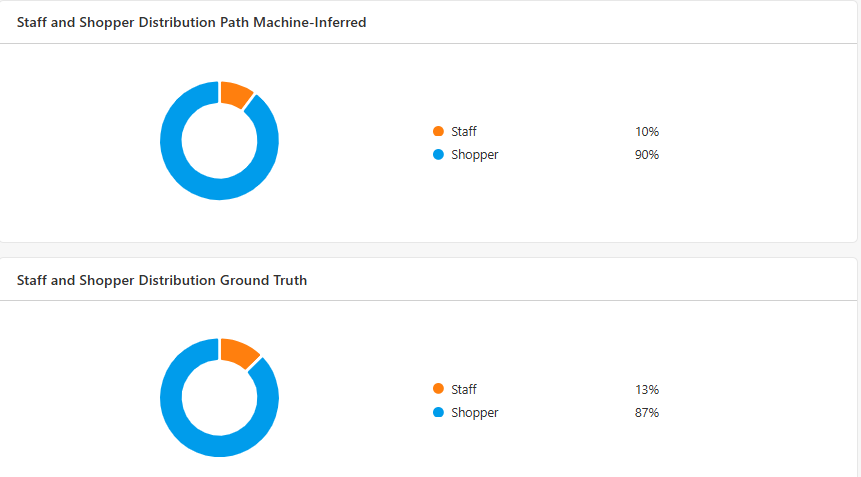
The pie charts provide a quick visual representation of the distribution between staff and visitors based on both machine-inferred predictions and ground truth annotations.
By comparing these distributions, users can quickly determine whether the system's classification performance aligns with the manually validated data, where a discrepancy of 5% is an acceptable difference to take into consideration.
If significant differences exist, further annotation campaigns may be required to retrain the model.
1.2 Scheduler
Users can schedule a campaign via the Scheduler Section, where images of each person entering the store at the scheduled hour are captured. To do so, press the "New Schedule" Button.

In order to schedule a campaign, users would need to:
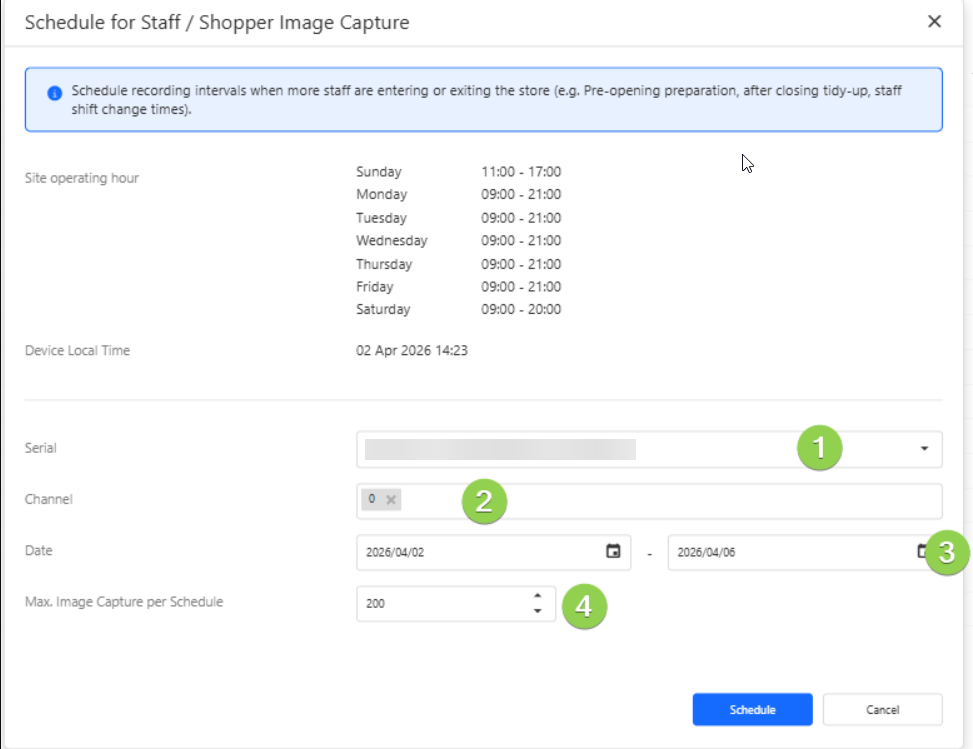
When creating a schedule, users need to
- Device Serial Number - identifies the specific people counting device.
- Channel Number - provides the specific channel(s) needed to be recorded.
- Recording Dates - the day(s) on which the recordings should be performed on.
- Maximum Number of Images - the limit for the total number of images captured during the campaign.
To obtain useful training data, it is recommended to schedule campaigns during periods with a mixture of staff and customer activity, such as:
- Predicted staff counts
- Actual staff counts identified during manual annotation
Once successfully recorded, a list of rows are produced, with a Harvest Status “Pending”. To harvest a campaign, or to turn a recording into a list of ready-to-use annotations, select the rows that would need to be harvested and press “Start Harvest” to harvest a single schedule, or “Bulk Harvest” for multiple campaigns.
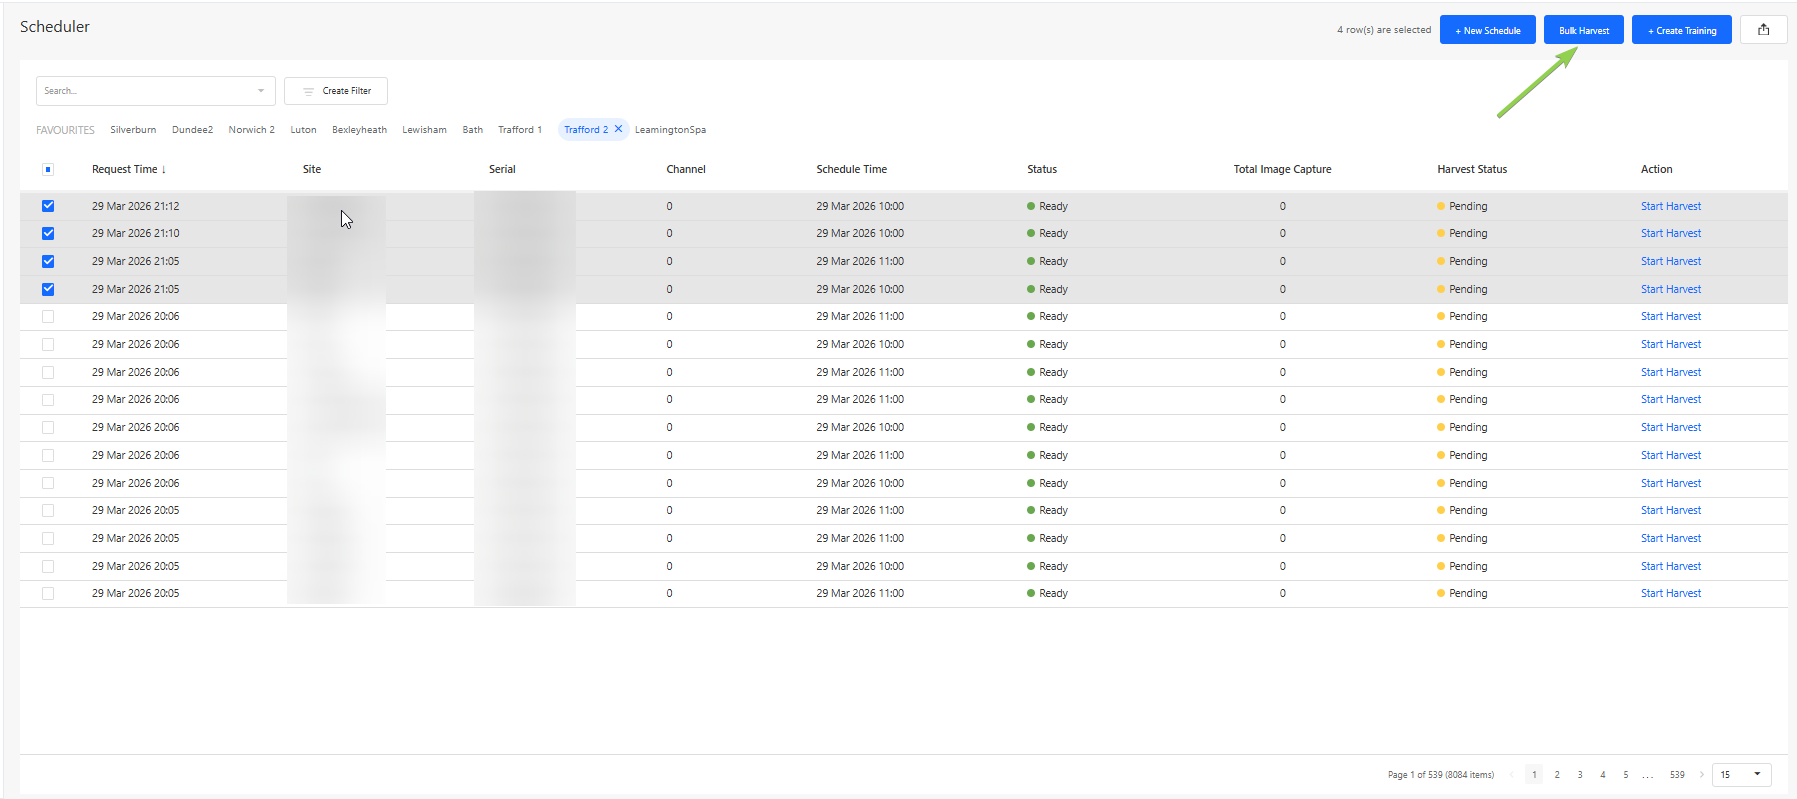
Once harvesting is done, there should be 2 statuses in the “Harvest Status” Column:
- Ready: The row is ready for training creation.
- Failed: The harvesting failed, and is not possible for training creation.
There will be row(s) available for annotation to be done, which can be selected on and begin creating an annotation training dataset by pressing “Create Training”
1.3 Training
In the Training Section, users can perform manual annotations on captured images from scheduled campaigns.
These annotations form the ground truth dataset, which is used to validate and improve the machine learning model responsible for identifying staff members.
Each campaign contains a collection of images captured during the scheduled recording window. The number of captured images should generally correspond with the number of detected entries into the store during that time period.
There are several use cases for the training workspace, namely for creating a ground truth to be compared with in the Overview section, or to provide additional training to improve the accuracy of the model.
This retraining of the model would be helpful in several operational scenarios:
- If a store layout changes (e.g., relocating entrances, installing barriers, or modifying checkout areas), movement patterns may change and require revalidation.
- If previously distinct staff uniforms change or staff no longer wear identifiable clothing, the system may require retraining to maintain classification accuracy.
To begin annotating a campaign, users can click the "Annotate" button.
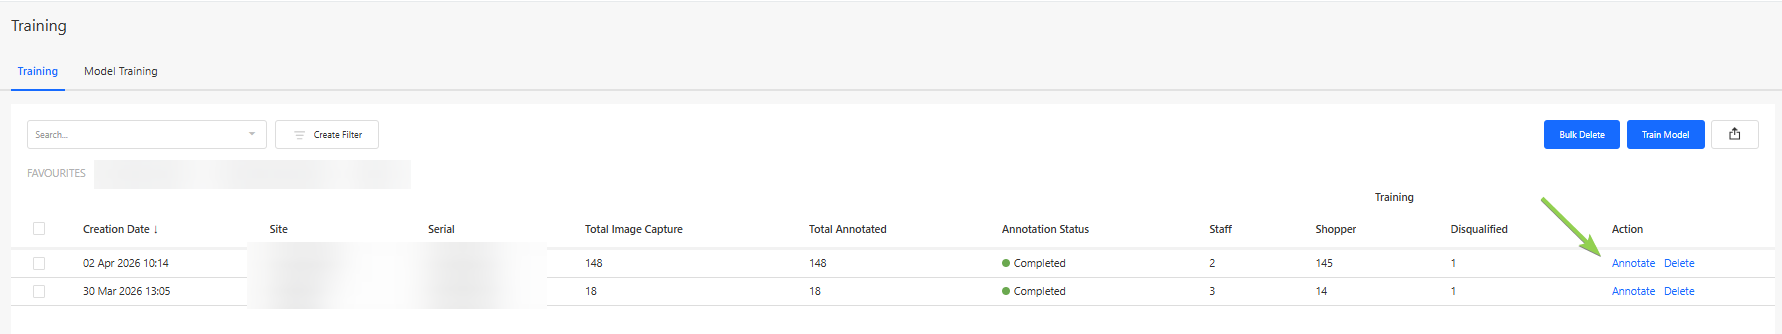
The goal of the annotation process is to classify each captured individual as one of the following:
- Staff Member
- Visitor
- Disqualified Image
These labels allow the system to classify and then train the model via visual and behavioural features that are associated with staff members and visitors.
1.3.1 How to Perform Annotations
Users can annotate on a campaign by identifying and annotating the images captured as a staff member or a visitor.
If the image shows a staff member, select all of the staff images and press the “1” button.
If the image shows a visitor, no action is required, as visitors are considered the default category. However, if you wish to change the status from “staff” or “disqualified”, select all relevant images and press the “2” button.
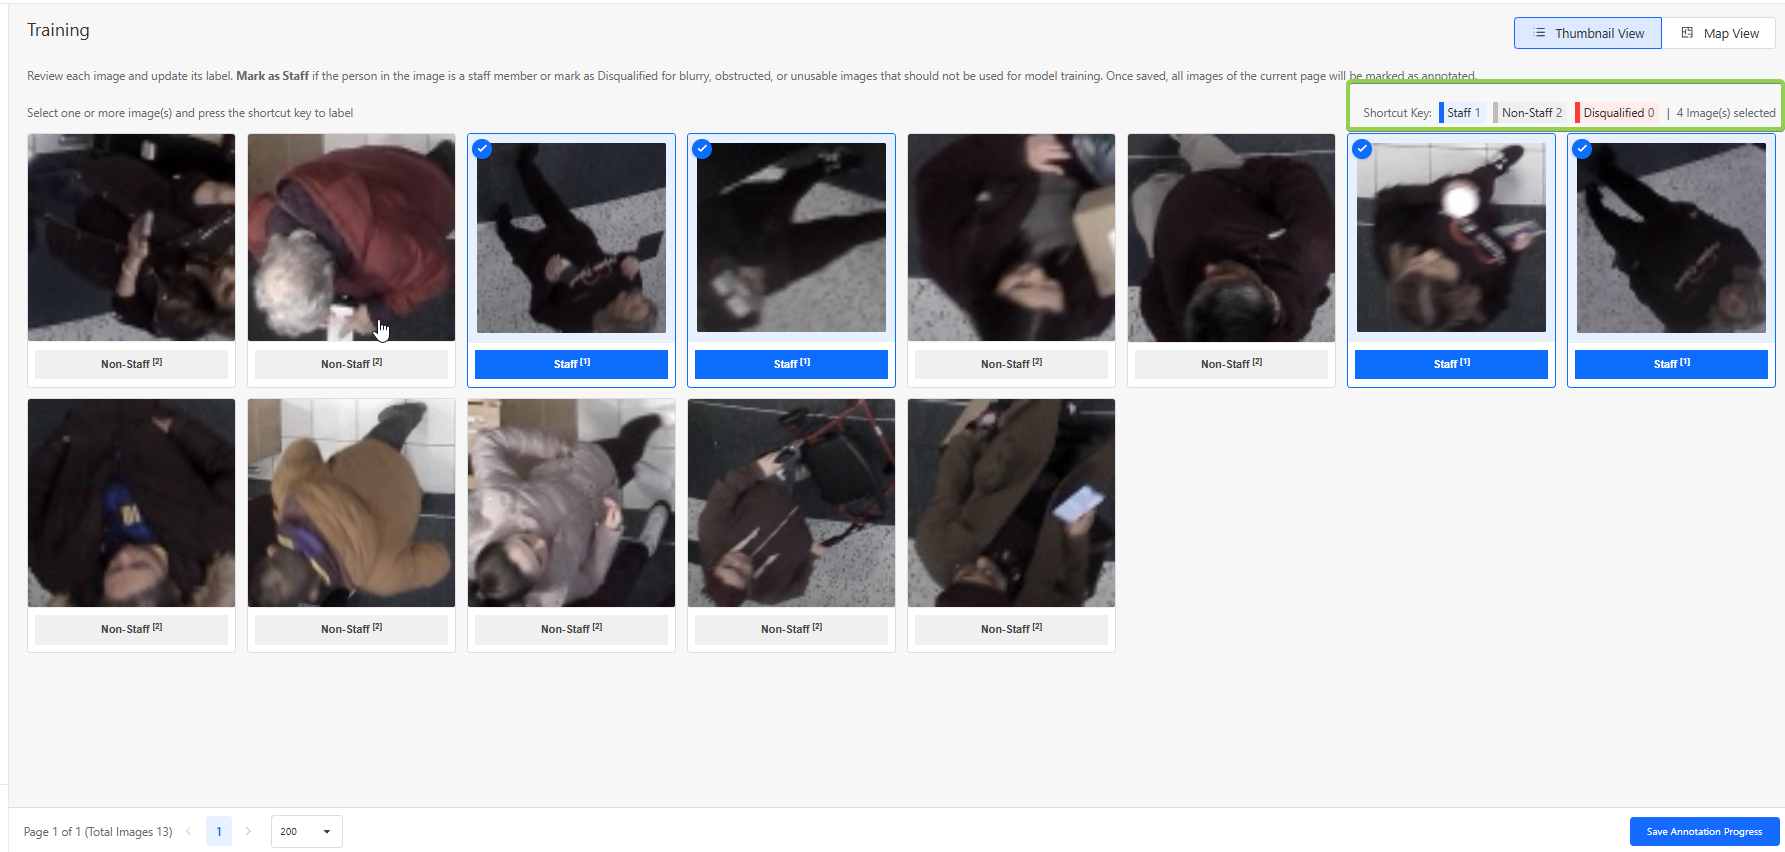
Disqualified Images
Some captured images may not be suitable for model training. These should be marked as Disqualified, by selecting all disqualified images and selecting “0”
Examples include:
- Extremely blurry images
- Images where the person is extremely obstructed
- Images where the person cannot be clearly identified
- Images where the image is falsely captured as a human
- Images with extreme lighting conditions
Below are some examples of images that are likely to be disqualified:

Using the Map View
For additional context, users may click on a selected image and open the Map View.
The Map View displays:
- The movement path of the detected individual
- Up to three images captured during different moments of the same trajectory
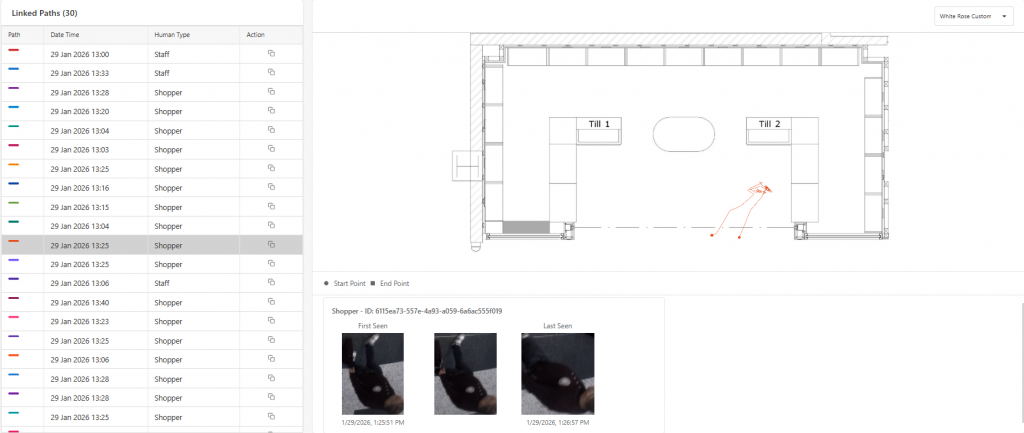
By observing these movement patterns, users can make more accurate annotations.
Annotation Status
Once annotation is completed, the user can click on "Save Annotation Progress", and an option to change the stage to 3 different categories can be made.
These statuses are:
- In Progress: The campaign annotation is partially completed or requires further review.
- Completed: All images in the campaign have been successfully annotated and are ready for training.
- Not Useful: The campaign data is unsuitable for model training (e.g., poor image quality or incorrect scheduling).
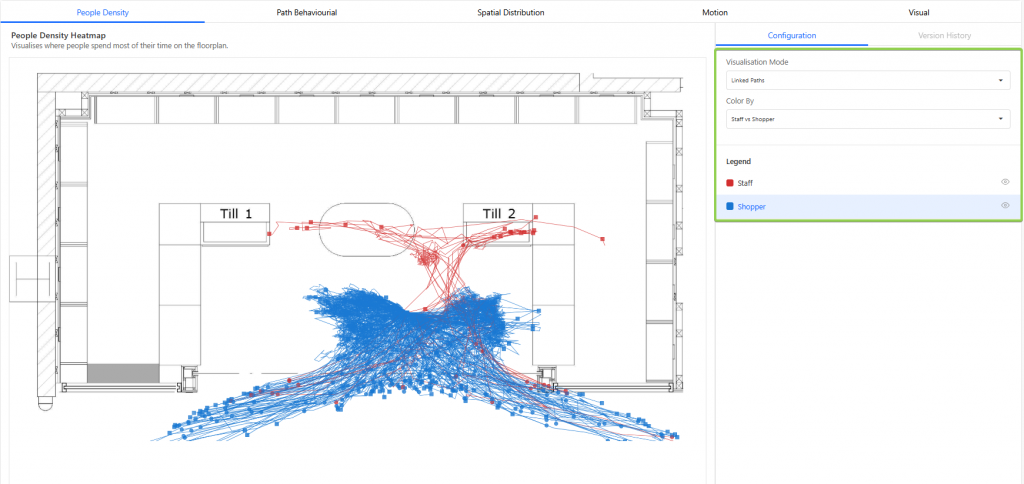
1.4 Risk Map
The Risk Map Section allows users to analyse movement behaviour and spatial patterns derived from the annotated data.
Using this data, the system generates visualisations that help users compare how staff and visitors move within the store environment.
Two main visualisation modes are available:
- Heat Map: Highlight areas with high movement or dwell density.
- Linked Paths: Allows for viewing of each individual path taken by a person.
Users can toggle between staff-only data and visitor-only data to observe behavioural differences.
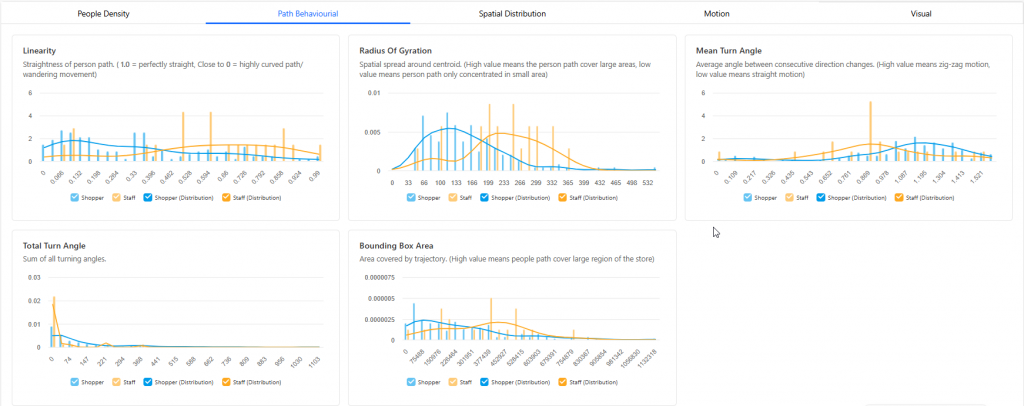
Analytical Tabs
Several other tabs also allow for the comparison of data between staff and visitors, which can be accessed via the 4 tabs:
- Path Behavioural: Data being derived from overall movement patterns to understand how individuals navigate and interact with a space.
- Spatial Distribution: Where movement is primarily located within the space by capturing the average position and the furthest points reached along both the X and Y directions.
- Motion: Data derived from how fast and consistently a person moves, including their overall speed, peak speed, speed variability, and total time spent being tracked.
- Visual: Determine the type of person entering the store based on visual cues.