Age Classification
1.0 Age Classification
The Age Validation Workspace is designed to help users verify and improve the accuracy of the Age Classification within the people counting system.
In many retail environments, people are always moving in and out of the store during operating hours. Without proper identification, the age distribution may be incorrectly counted, which can significantly distort analytics such as:
- Age Distribution
- Demographic trends
This section focuses on how users can validate, benchmark, and confirm the overall age distribution of an area using annotated images and comparison tools, whilst feeding the model accurate data to improve future predictions.
The system will automatically generate machine-inferred predictions that estimate whether a person entering the store is from the "Children", "Teenager", "Adults" or the "Elderly" category on an AI model. However, validation can be done:
- If there are doubts about the accuracy of the machine-inferred results.
- To help improve our future predictions for a specific site and can be replicated and reused for multiple sites of the same company by correctly identifying a person's age category, used for further model training.
The process of the Validation Workspace enables users to compare our current machine predictions with ground truth annotations collected from scheduled image campaigns, and users can review differences and determine whether the model is accurately predicting the age category of each person. The workspace mainly visualises the data through the overview graph that compares both machine inferred and ground truth annotation.
By analysing this data, users can validate the effectiveness of the AI model and improve the reliability of age data for their store environment.
1.1 Overview
Users can use the Overview Section to obtain an overall high-level summary of the number of each age category being predicted when people enter the store. This page also provides a visual comparison between machine-inferred predictions and ground truth annotations, allowing users to quickly evaluate model performance and identify discrepancies.
The data is presented through a series of charts and summary panels that highlight:
- Hourly distribution of each age category, comparing both machine-inferred predictions and ground truth annotations.
- Daily summary of each age category.
- Hourly summary of each age category
- Distribution of Machine-Inferred
- Distribution of Ground Truth Annotations
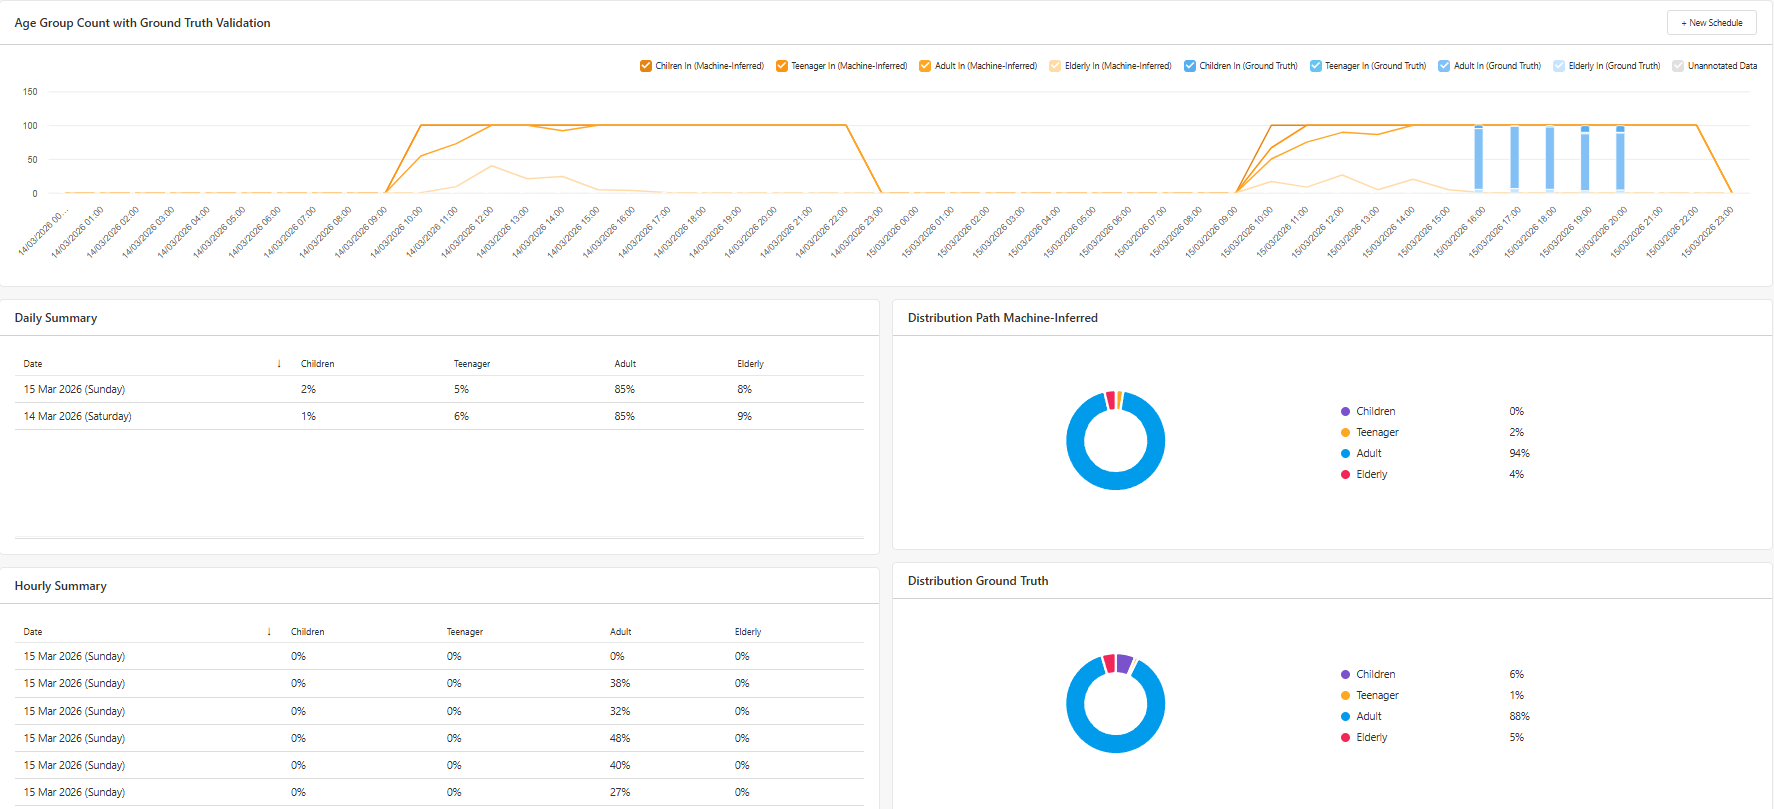
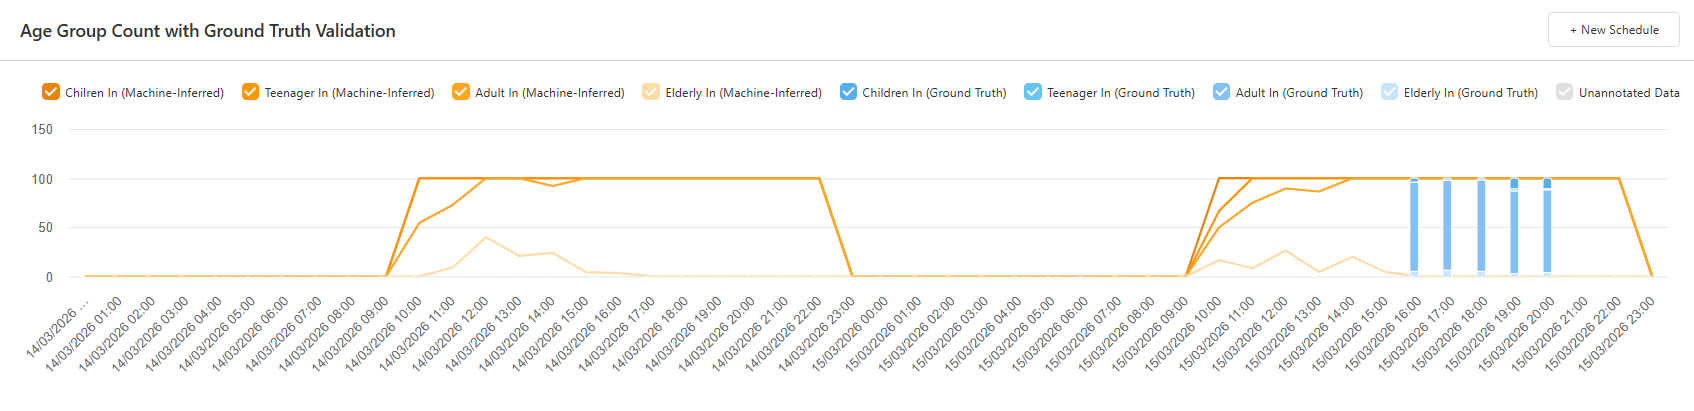
The validation graph compares the number of annotated images (Ground Truth) against the machine-inferred predictions.
This comparison allows users to identify potential differences between:
- Predicted age category
- Actual people in each age category identified during manual annotation
These differences can be analysed on an hourly basis, helping users determine whether the model consistently misclassifies individuals during certain periods of the day.
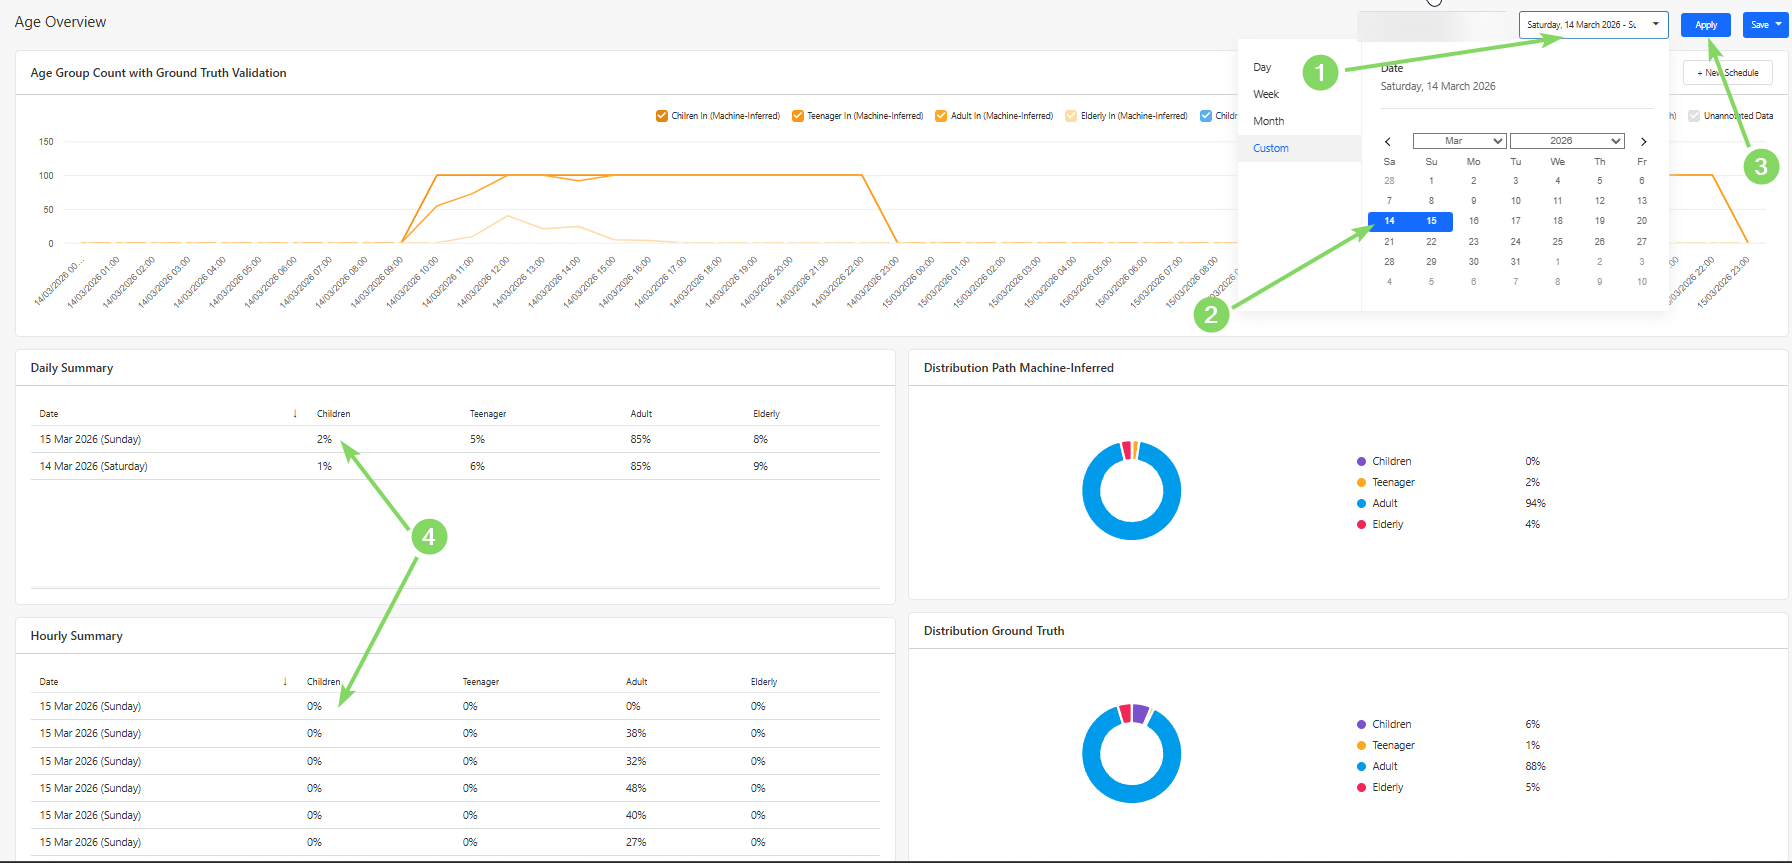
Users can also view a daily summary of machine-inferred predictions of the number and trend of each age category by selecting a date range, as demonstrated in the picture below. This summary shows the overall trend of the predicted age category of each person.
The pie charts provide a quick visual representation of the distribution between each age category based on both machine-inferred predictions and ground truth annotations.
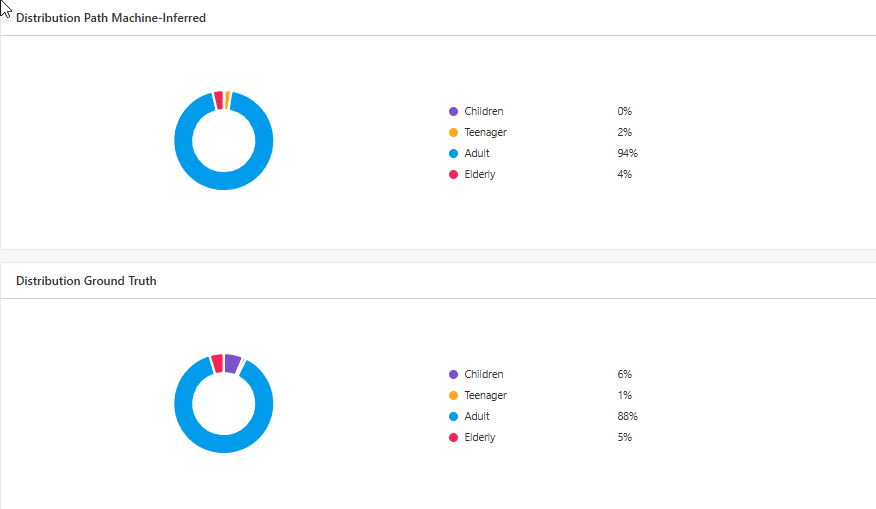
By comparing these distributions, users can quickly determine whether the system's classification performance aligns with the manually validated data, where a discrepancy of 5% is an acceptable difference to take into consideration.
If significant differences exist, further annotation campaigns may be required to retrain the model.
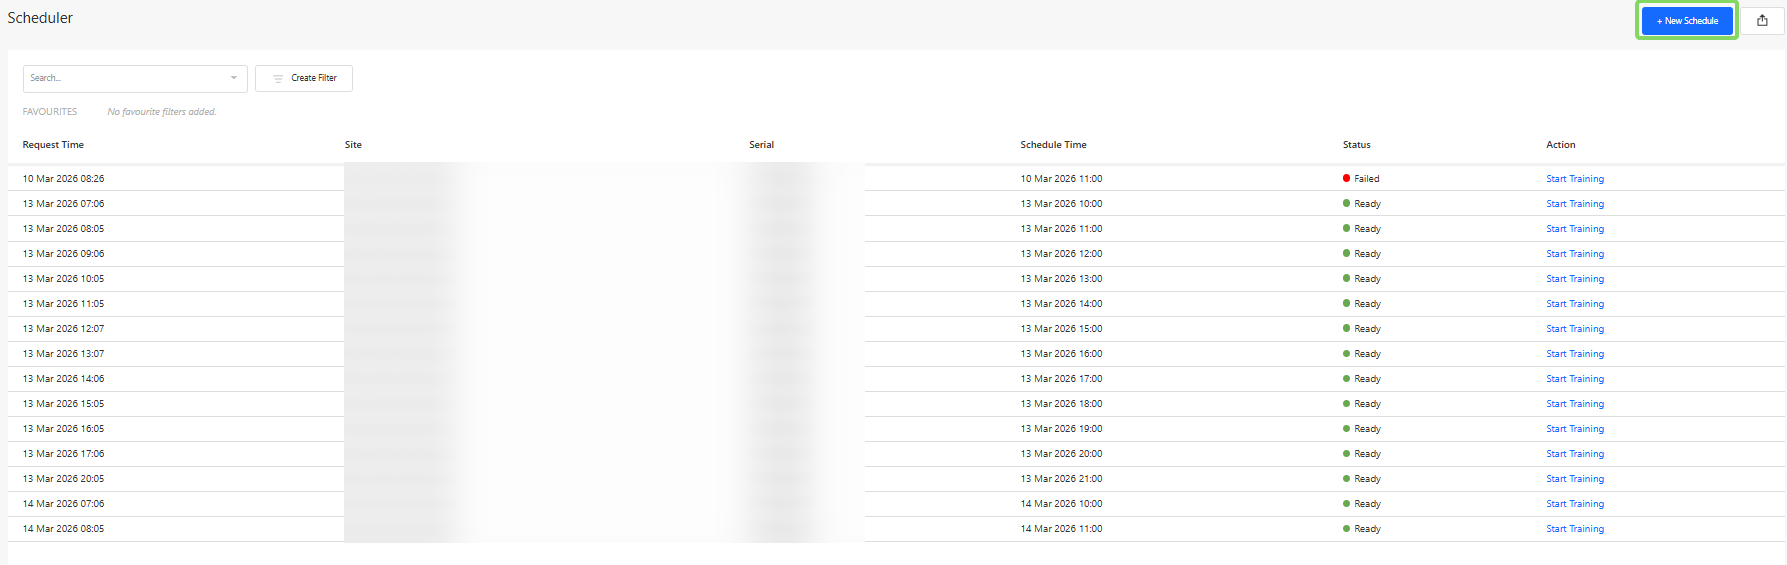
1.2 Scheduler
Users can schedule a campaign via the Scheduler Section, where images of each person entering the store at the scheduled hour are captured. To do so, press the "New Schedule" Button.
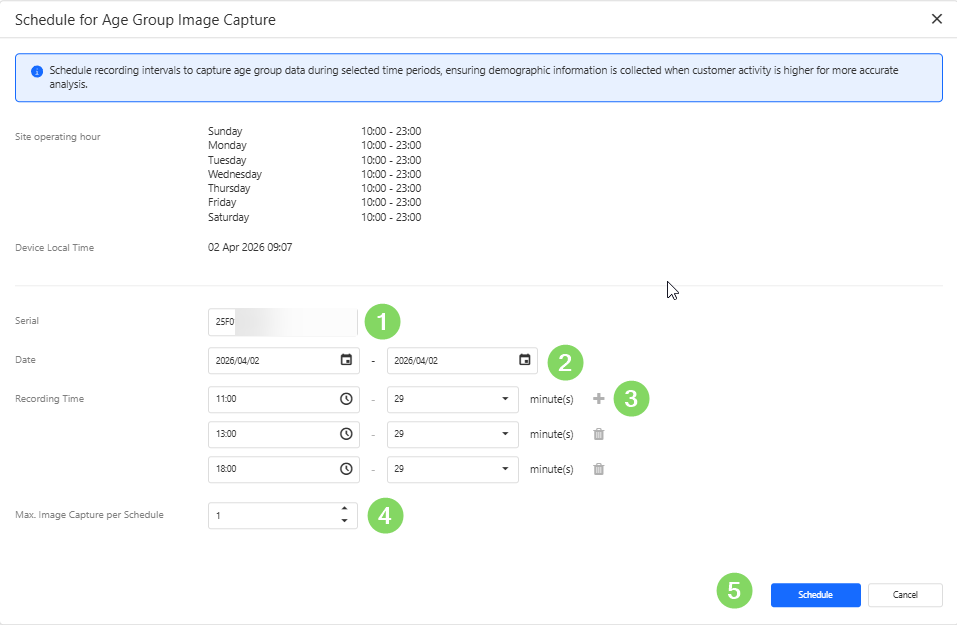
In order to schedule a campaign, users would need to:
When creating a schedule, users need to
- Device Serial Number - identifies the specific people counting device.
- Recording Dates - the day(s) on which the recordings should be performed on.
- Recording Time Window - the hours during which images should be captured.
- Maximum Number of Images - the limit for the total number of images captured during the campaign.
To obtain useful training data, it is recommended to schedule campaigns during periods with a mixture of all ages activity.
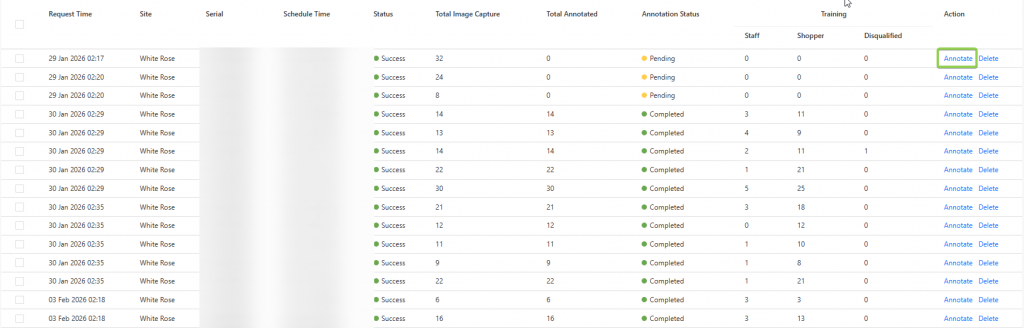
Once successfully recorded, the annotate button may be pressed to begin harvesting into a training campaign.
1.3 Training
In the Training Section, users can perform manual annotations on captured images from scheduled campaigns.
These annotations form the ground truth dataset, which is used to validate and improve the machine learning model responsible for identifying which age group a person is part of.
Each campaign contains a collection of images captured during the scheduled recording window. The number of captured images should generally correspond with the number of detected entries into the store during that time period.
There are several use cases for the training workspace, namely for creating a ground truth to be compared with in the Overview section, or to provide additional training to improve the accuracy of the model.
This retraining of the model would be helpful if a store has a varied age distribution and the current machine-inferred results do not match the ground truth annotations. The system may require retraining to maintain classification accuracy.
To begin annotating a campaign, users can click the "Annotate" button.
The goal of the annotation process is to classify each captured individual as one of the following:
- Children
- Teenager
- Adults
- Elderly
- Disqualified Image
These labels allow the system to classify and then train the model via visual features that are associated with the different age categories.
1.3.1 How to Perform Annotations
Users can annotate on a campaign by identifying and annotating the images captured as the above listed classifications.
If the image shows an Elderly, select all of the supposed Elderly images and press the "4" button or click on "Elderly" on the top right.
If the image shows an Adult, no action is required, as Adults are considered the default category. However, if you wish to change the status to "Children" or "Teenagers" or "Disqualified", select all relevant images and press the respective button or its assigned number/letter.
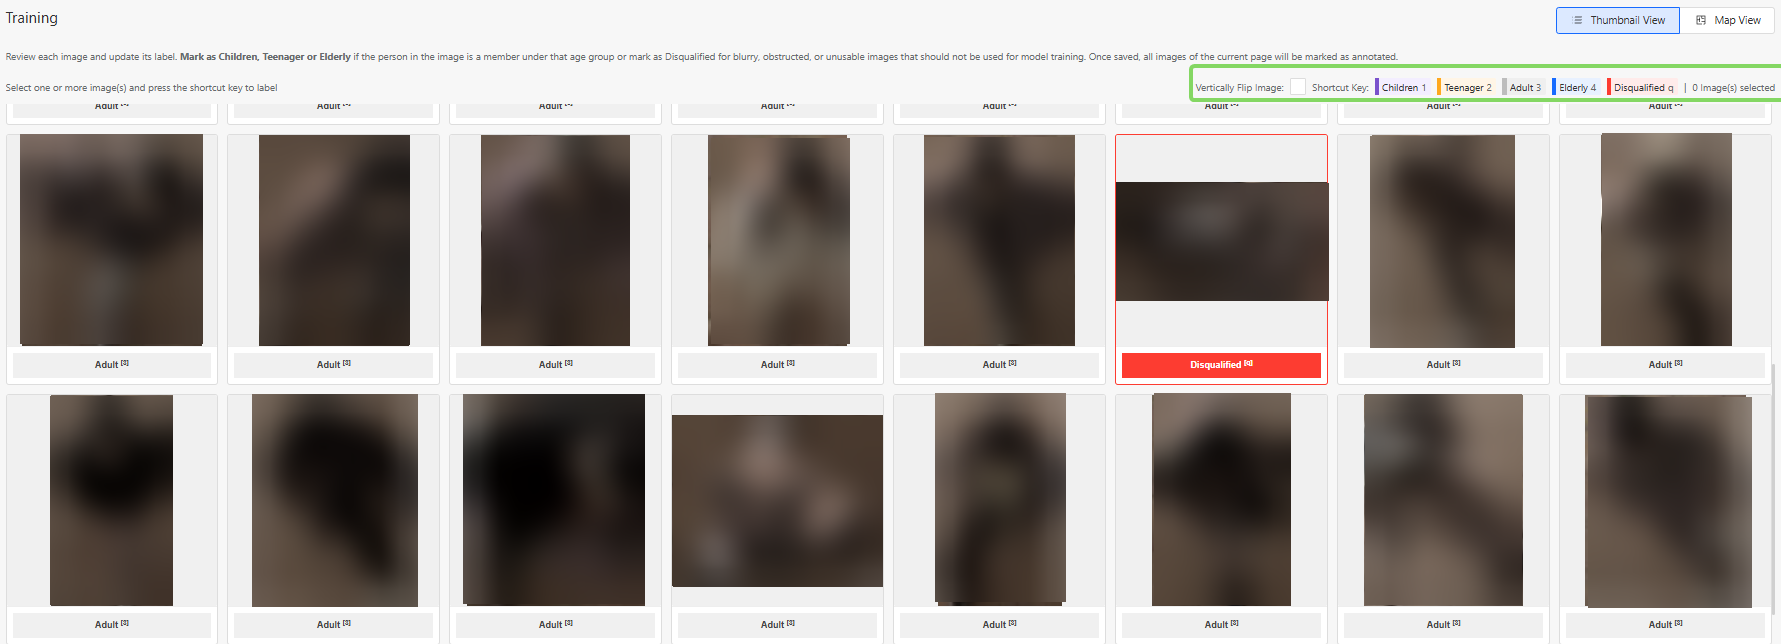
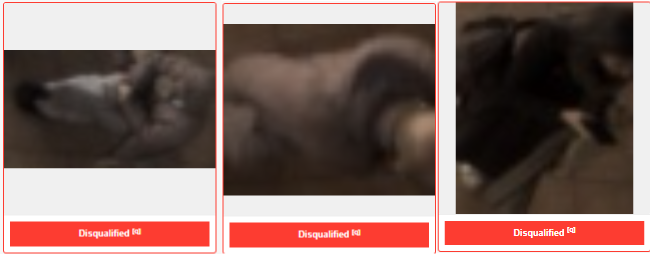
Disqualified Images
Some captured images may not be suitable for model training. These should be marked as Disqualified, by selecting all disqualified images and selecting "q"
Examples include:
- Extremely blurry images
- Images where the person is extremely obstructed
- Images where the person cannot be clearly identified
- Images where the image is falsely captured as a human
- Images with extreme lighting conditions
Below are some examples of images that are likely to be disqualified:
Using the Map View
For additional context, users may click on a selected image and open the Map View.
The Map View displays:
- Up to three images captured during different moments of the same trajectory
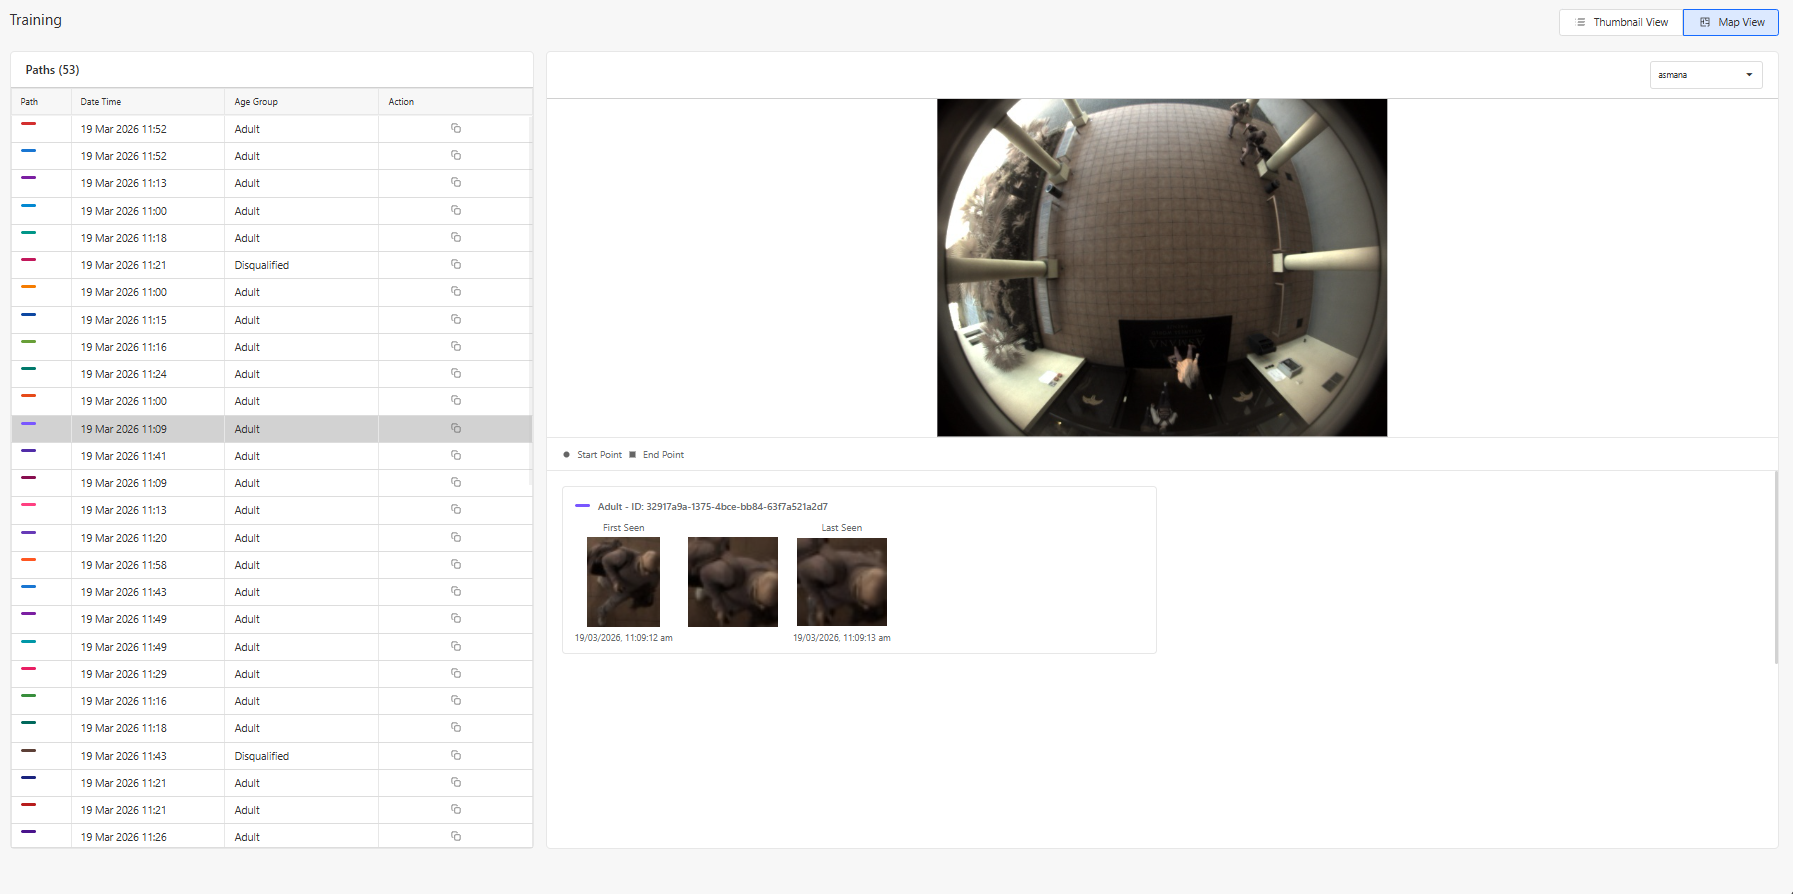
By observing these movement patterns, users can make more accurate annotations.
Annotation Status
Once annotation is completed, the user can click on "Save Annotation Progress", and an option to change the stage to 3 different categories can be made.
These statuses are:
- In Progress:The campaign annotation is partially completed or requires further review.
- Completed: All images in the campaign have been successfully annotated and are ready for training.
- Not Useful: The campaign data is unsuitable for model training (e.g., poor image quality or incorrect scheduling).