Queue analytics is a key metric to understanding customer satisfaction in various industries, such as fast food restaurants[1], supermarkets[2] and airports[3]. Business operators are in dire need for real-time data on customer flow and queue wait durations, so that they can optimize on the number of service cashiers required, service SOP and cashier trainings. A satisfied customer is a customer who does not need to wait too long in a queue to checkout.
By understanding and responding to customer behaviour patterns, business can significantly enhance the shopping experience, leading to increased customer satisfaction, loyalty, and ultimately, profitability. This aligns with the overarching business need to create a seamless and positive customer journey, which is integral in today’s competitive business landscape.
In the current market, there are plenty of sensor-based queue analytics solutions to track customer journey in a queue. For example, FootfallCam 3D Pro2 is a stereo vision camera system mounted on the ceiling, that does customer detection, tracking and queue counting, all in a single device.
Current Challenges
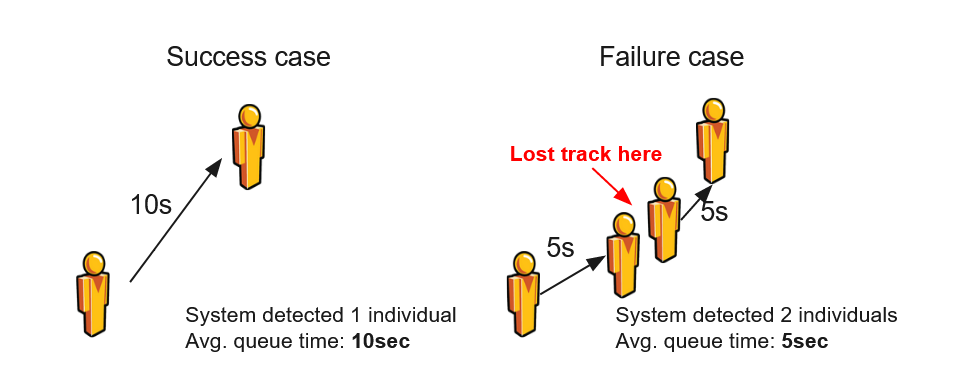
Although the FootfallCam 3D Pro2 achieves the highest-in-class 99% counting accuracy[4], it is still not 100% accurate. In fact, there is no people counter with perfect counting accuracy, due to the dynamics of human behaviours in real life. For examples:
- A customer leaves the trolley in the queue temporarily and goes out of the device coverage view
- A customer bends down to grab point-of-sale merchandise or impulse buy items

The result is that the duration of a customer waiting in the queue cannot be tracked continuously and effectively, and compromize the accuracy of average queue wait duration.
Rethinking Human Behaviours In Queues
To overcome the limitation, we have to rethink how customers queue up in a single queue, and how the average queue wait duration can be modelled from data statistics. Basically,
- The first customer in the queue, who arrives at an empty service cashier, does not need to wait at all.
- Subsequent customer needs to wait in the queue for as long as all the customers in front of him/her have been served and leave the queue.
- In other words, it is important to note how fast the service cashier serves the customers, and how long is the queue at the moment when a customer joins the queue.
Innovative Data Modelling Approach
In an essence of Big Data analysis, we make use of Central Limit Theorem[5] and Queue Theory[6] to derive the average queue wait duration formula from first principles, guided by the queueing behaviour modelling above.


This revolutionary formula breaks free from the limitations and challenges raised above, because we do not need to track each individual queuing customers continuously. All we need is the queue serve duration and queue length data, both of which we can ensure high accuracy.
Results Comparison
We compare the average queue wait duration with the ground truth to validate our data model. The old approach is susceptible to the dynamics of human behaviours, while the new approach is a statistical modelling.
This test is taken from 1-hour long data, with queue length being sampled every 5 seconds. There are 1000 customers queuing up naturally in this test.

The results show that the new metric outperforms the old metric, improving from 99% to 99.9% accuracy. The accuracy improvement is expected to be larger for harsher environments where device counting accuracy can be lower.
Conclusion
This is a showcase of using modern data-driven statistical approach to tackle an age-old problem in queue analytics. This will help all industries to better measure the customer satisfaction, service cashier KPI as well as to surface any operational inefficiency.
With better data metrics and visibility, businesses can now reduce cost and increase sales more effectively.
FAQs :
1. Which devices support this new metric for average queue wait duration?
All the devices which have the Queue Counting feature, support this new metric for a more accurate average queue wait duration. The devices include FootfallCam 3D Pro2, 3D Prowave, 3D Extend and Centroid. Kindly contact [email protected].
2. Can I have both the old and new metrics at the same time?
Absolutely, however we strongly encourage using the new metric for its superior accuracy.
References:
- “Fast Food Restaurants Queue Counting“. by FootfallCam.
- “Supermarkets Queue Counting“. by FootfallCam.
- “Airports Queue Counting“. by FootfallCam.
- “Top 5 3D People Counters“. by FootfallCam.
- “Central Limit Theorem“. by Wikipedia.
- “Queueing Theory“. by Wikipedia.


