


Software Functions
See other dashboard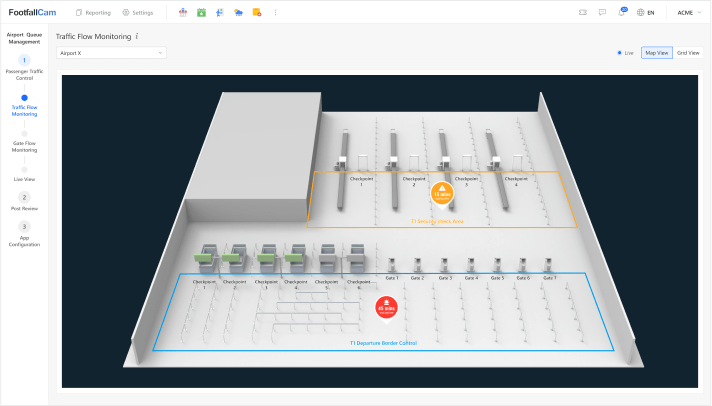
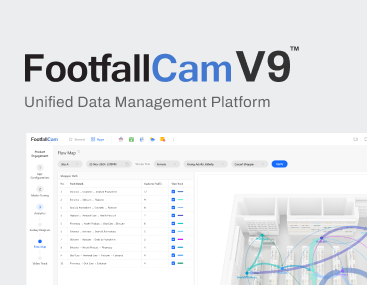
Live Traffic Map View
Designed for: Airport operators
- Provides airport operators with a real‑time 3D map of terminal zones, displaying queue lengths and waiting times instantly.
- Alerts trigger when thresholds are exceeded, enabling swift opening or closing of service counters to manage passenger flow without delay.
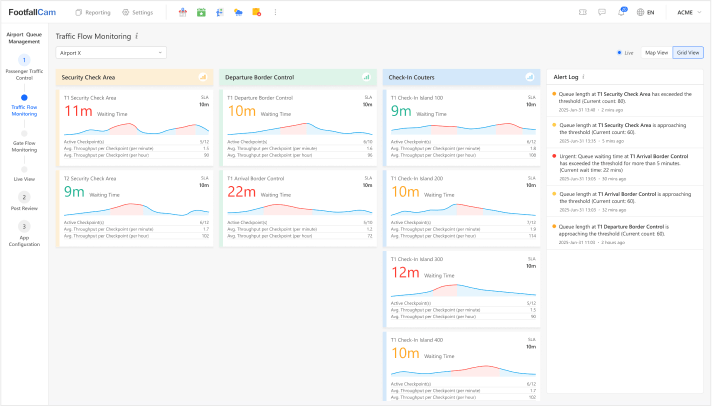
Traffic Flow Grid Dashboard
Designed for: Airport operators
- Delivers a grid‑style command centre view with real‑time alerts on queue build‑ups across all service points.
- Operators can quickly pinpoint congestion hotspots and reallocate resources to maintain smooth passenger movement and avoid delays.
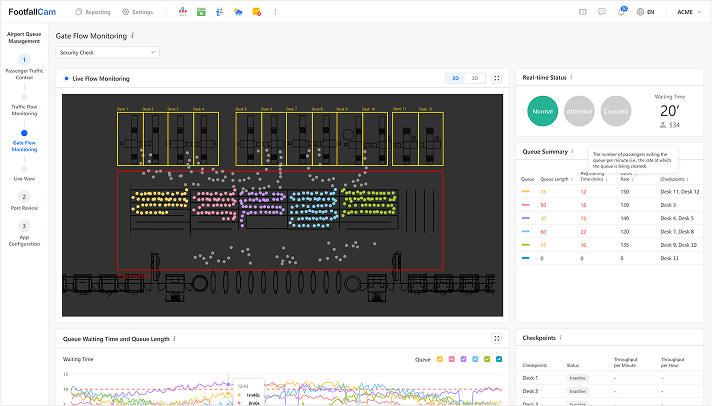
Live Gate Flow Monitor
Designed for: Operation team and airport operators
- Shows the live queue situation at every checkpoint, allowing users to drill down into individual lane waiting times.
- The system dynamically detects queue structures based on real‑time passenger patterns, supporting targeted interventions where they’re needed most.
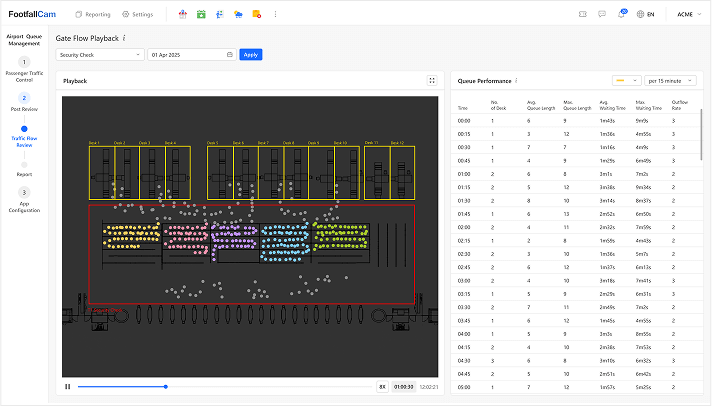
Gate Flow Playback Report
Designed for: Operations managers and analysts
- Enables operations managers to replay historical queue data to identify bottleneck locations and underperforming service counters.
- Analysing where delays occurred supports data‑driven improvements in staffing levels and process efficiency.

Queue SLA Performance Report
Designed for: Airport Management Team
- Offers a high‑level overview of SLA compliance across all checkpoints.
- Management can review service provisioning adequacy against passenger demand over time, quantify performance gaps, and make strategic decisions to uphold service standards.
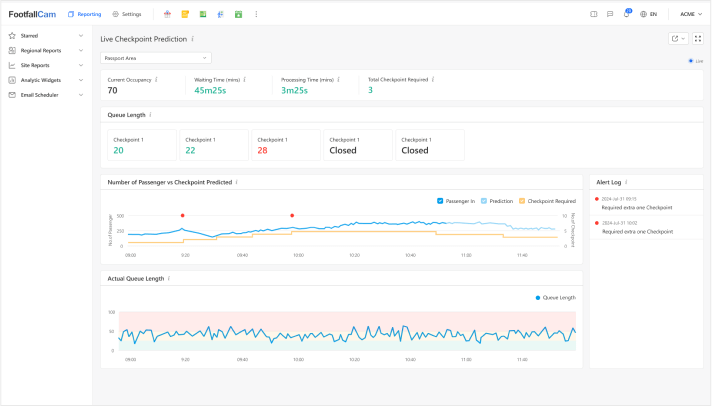
Live Queue Prediction Dashboard
Designed for: Operations teams
- Uses historical queue data and real‑time flow metrics to forecast queue lengths for the remainder of the day.
- This enables operations teams to optimise resource allocation in advance, reducing potential wait times and improving passenger experience.
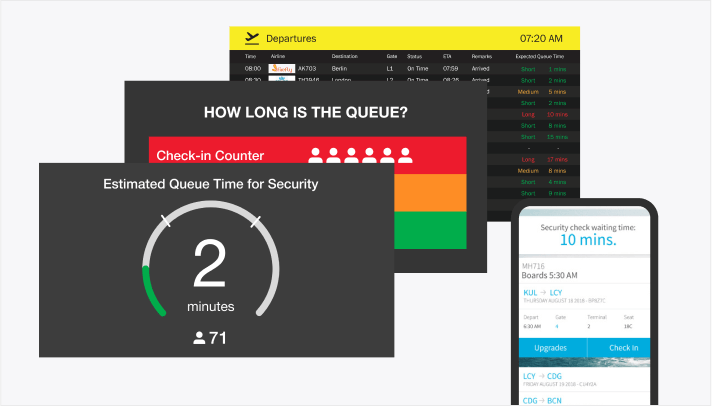
Live Dashboard for Passengers and Operators
Designed for: Passengers & customer‑service teams
- Provides passengers with immediate wait‑time displays to set realistic expectations and reduce perceived delays.
- Real‑time alerts empower staff to respond swiftly to overcrowding or anomalies, ensuring safety and comfort.
Analytics Features
Aid retailers in customising data views with drill-up and drill-down capabilities

Pivot Grid
Provides flexibility to drag and drop business metrics into an unified view and slice-and-dice the data to explore and analyse it from multiple dimensions.

Analytics Centre
Create widgets with desired business metrics and customise reports or dashboards using mix-and-match widgets available, save the customised view for future usage

Time Series Comparison
Particularly valuable during festive seasons, analyses footfall patterns between current and preceding periods, using various data granularity levels.

Rule Engine
Use rule engine to configure thresholds, notifications, and business rules for automated real-time alerts

Entity Comparison
A tool to compare and analyse data from different entities, identifying similarities and differences for insights.

Heatmap Table
Visually represent data with colour-coded intensity, enabling quick understanding of footfall patterns, trends, and relationships within the dataset.