-
Products
-
 AI Box
AI Box-16
AI Box-32
AI Box-64

Product Selector
Select the right product

Device Calculator
Coverage & device estimation

Accessories
Mounting bracket & accessories

Floor Plan Designer
Design your ideal solution
-
-
Industries
-
Business Segments
-
-
Resources
-
Partners
-
Partner
-
-
Company
- Buy Now
- Contact Us
- Portal Login
Customer Journey Analytics
Learn customer behaviour, product engagement, and visit durations to improve merchandising, plan promotions, and boost sales.

“Optimise Every Experience”
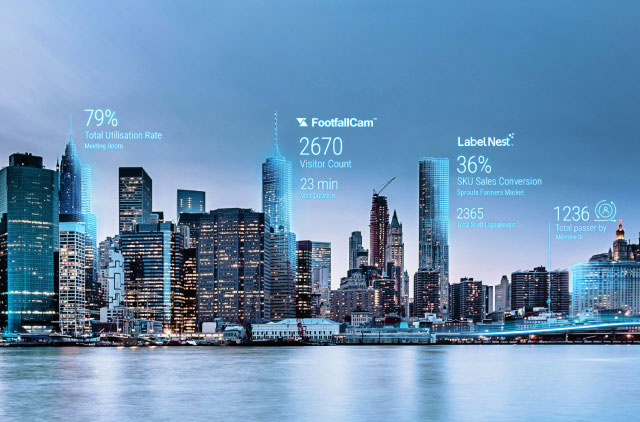
Understanding customer behaviours through quantifiable touchpoints is essential for retailers. To optimise operations and workflows with measurable data, FootfallCam offers the tools needed to meet this demand. For example, our apps measure uplift from promotional events, quantify the impact of various weather conditions, classify customers based on shopping behaviour, and ultimately help retailers maximise sales potential for each store according to its specific profile and customer patterns.
Innate Demand
The reach of your store locations and their accessibility to potential customers.
Attract
The effectiveness of your branding and promotions in capturing target groups.
Engage
Learn customer behaviour, evaluate touchpoints, identify replicable actions.
Transact
Identify windows of opportunity and maximise conversion rates for prospects.
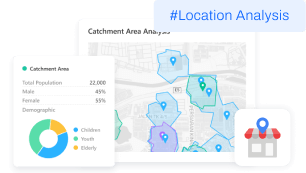
#Location Analysis
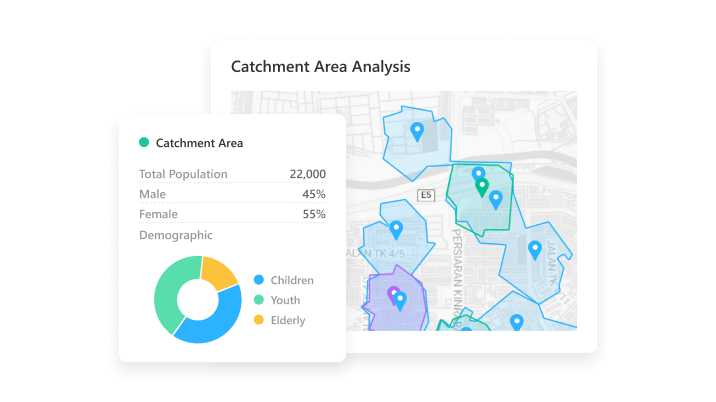
Who are the captive demographics?
Businesses often struggle to identify target market, leading to missed sales opportunities
- Quantify potential sales opportunities
- Identify potential prospects and their demographic breakdown
- Assess purchasing potential using economic and financial data
#Location Analysis
How accessible are your store locations?
Unclear store location accessibility can hinder growth.
- Learn the ROI of new location reach
- Identify nearby competition and untapped opportunities
- Assess if the rental rate matches potential foot traffic
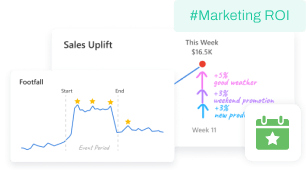
#Marketing ROI
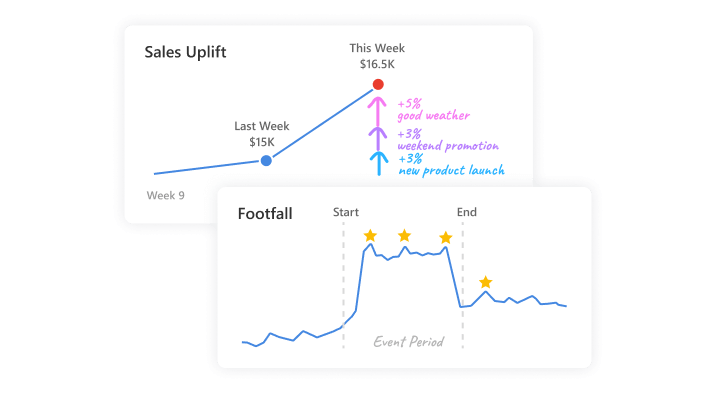
How well are the store’s captive demographics converting into footfall?
Having a store at a prime location may not guarantee higher store visits
- Measure conversion of footfall potential into store visits
- Learn the demographics of your visitors.
- Evaluate how well promotional events attract the target audience and replicate successful ones
Engage
Measure and identify popular areas/products. Quantify the effectiveness of each touchpoint.
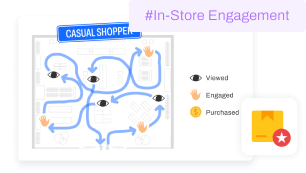
#In-Store Engagement
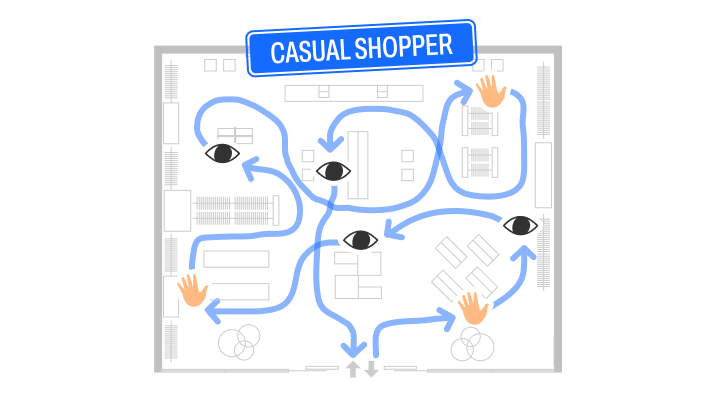
Which area do customers interact with the most?
Retailers often lack visibility into customers' shopping behaviour.
- Understand how customers engage with store touchpoints
- Determine if visit length correlates with increased sales
- Measure the effectiveness of staff actions and promotional events
#In-Store Engagement
Do you have the right staff-to-customer ratio?
Store managers may struggle to pre-plan staff resources for fluctuating footfall.
- Pre-plan staff allocations based on predictive footfall
- Ensure timely service and restocking
- Maintain an optimal staff-to-customer ratio to prevent understaffing or overstaffing
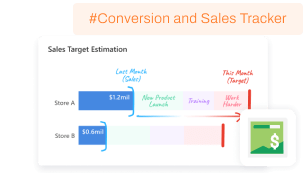
#Conversion and Sales Tracker
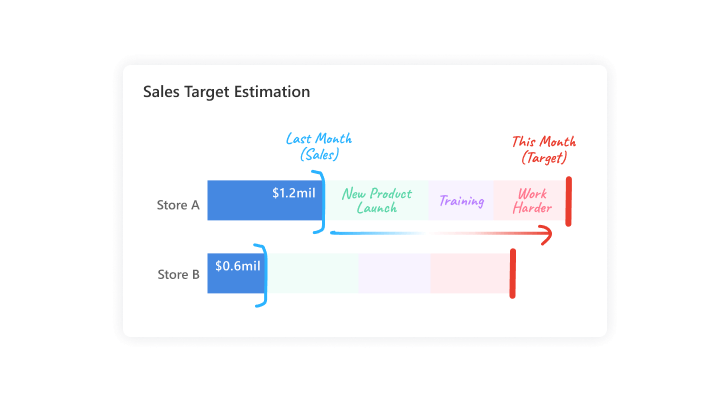
What is your store's maximum sales potential?
Each store is unique, making it challenging to set targets that maximise sales potential
- Categorise stores based on common characteristics
- Set realistic sales targets for stores within the same cluster
- Recommend tailored strategies to optimise sales revenue
Ready to learn more?
Copyright © 2002 - 2025 FootfallCam™. All Rights Reserved.
Cookies Notification
We use cookies to ensure that we offer you the best experience on our website. By continuing to use this website, you consent to the use of cookies.
Select Your Language
Please select your prefer language.

